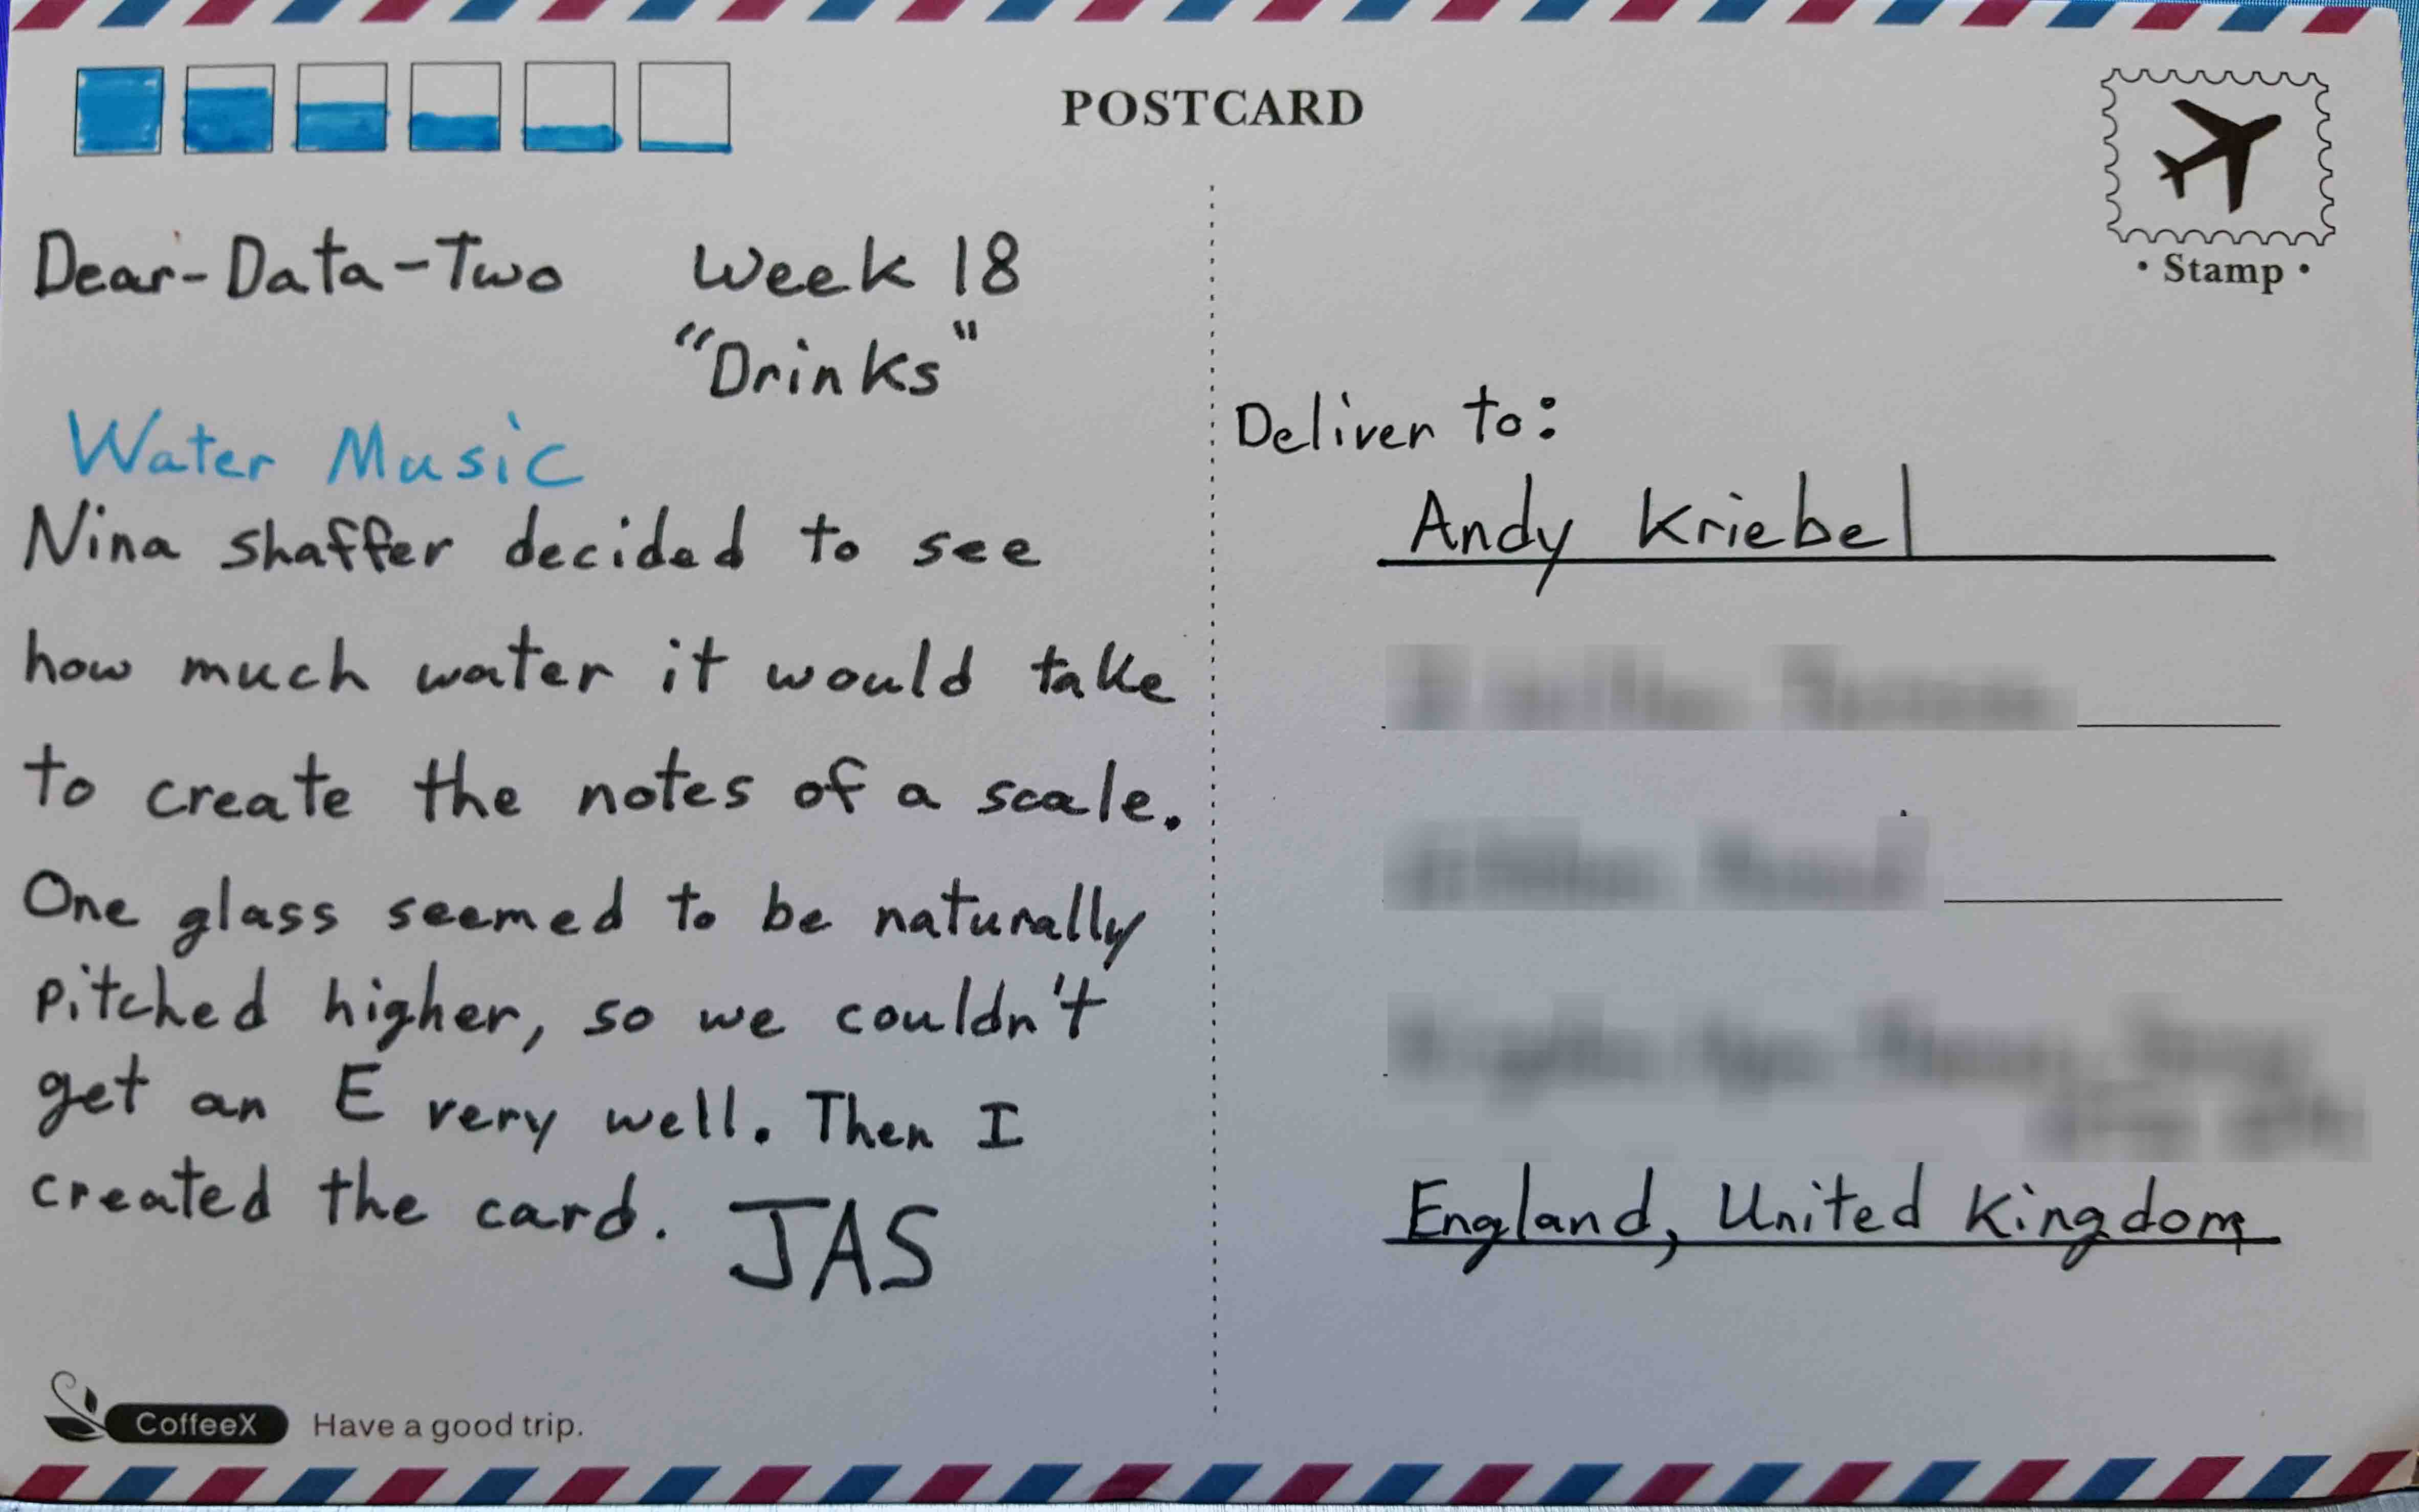
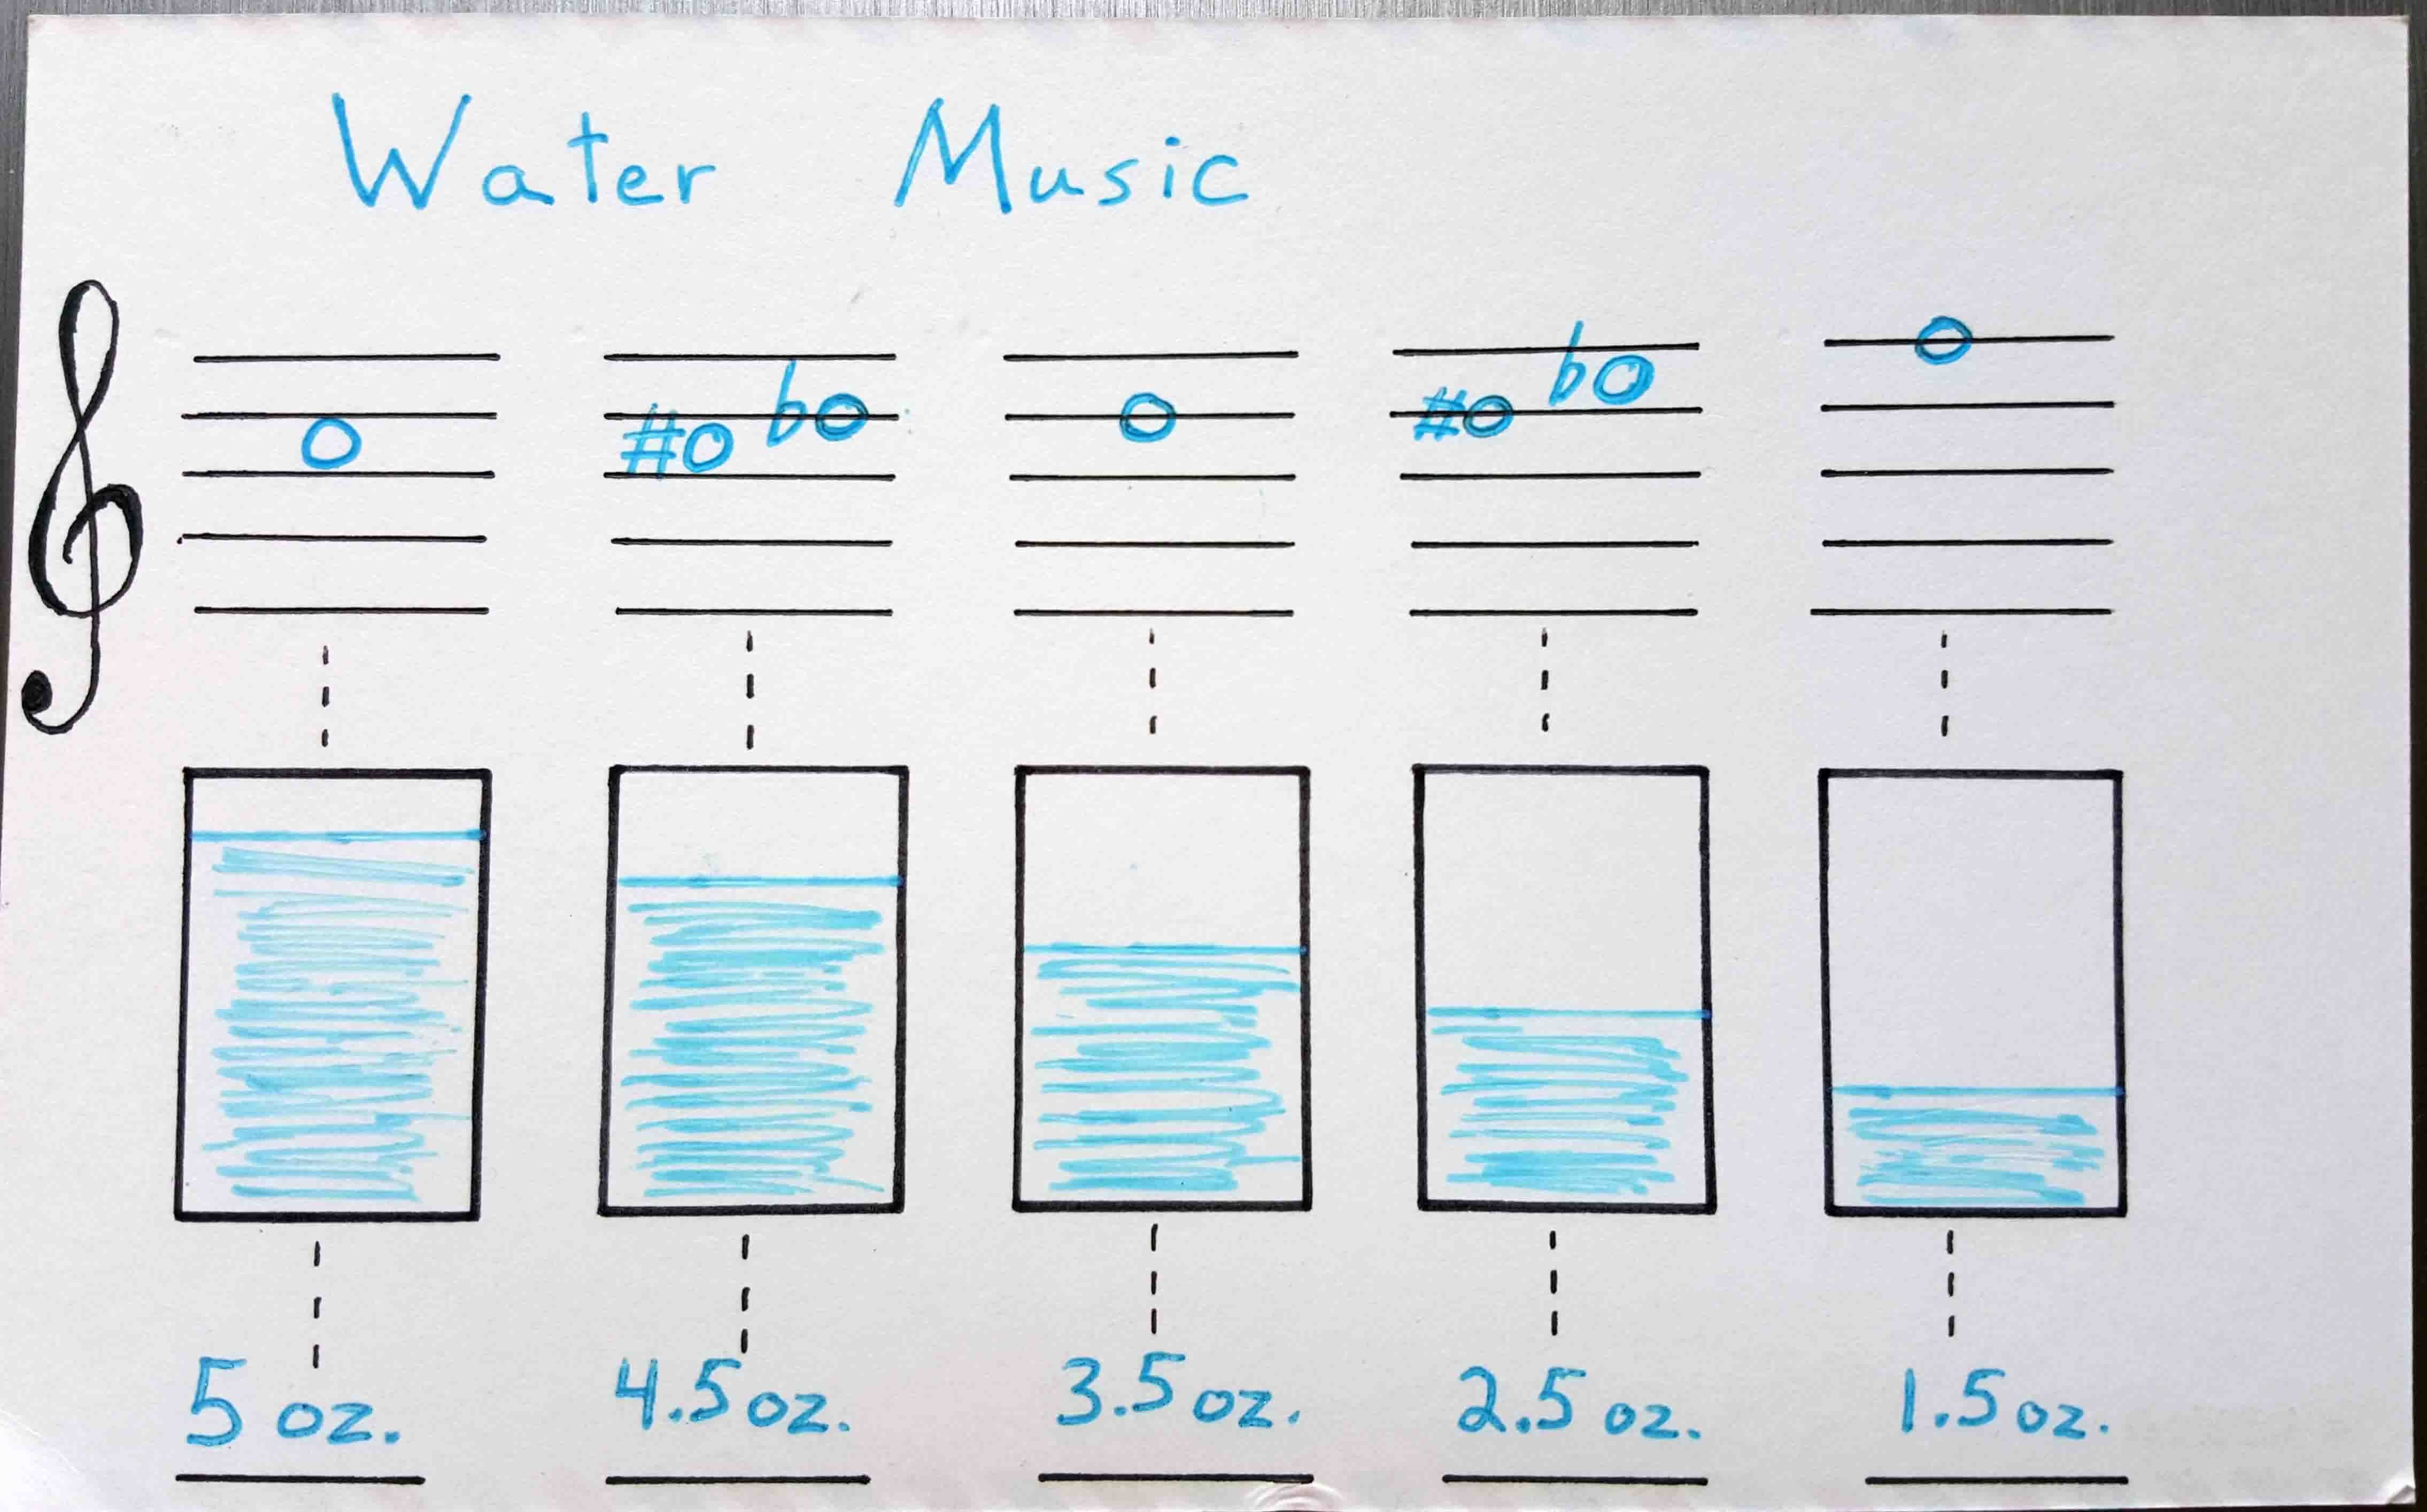
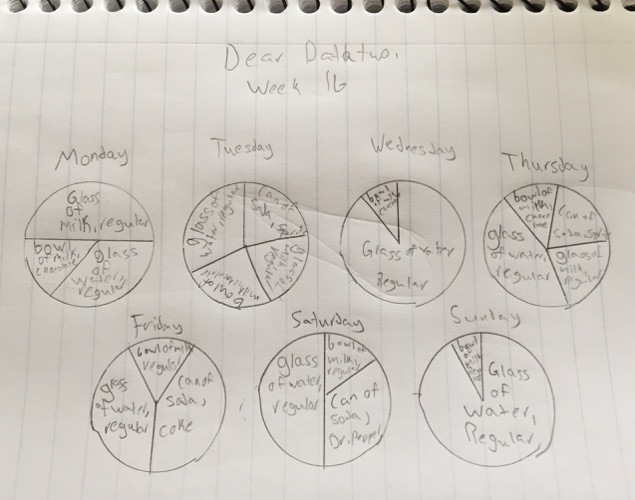
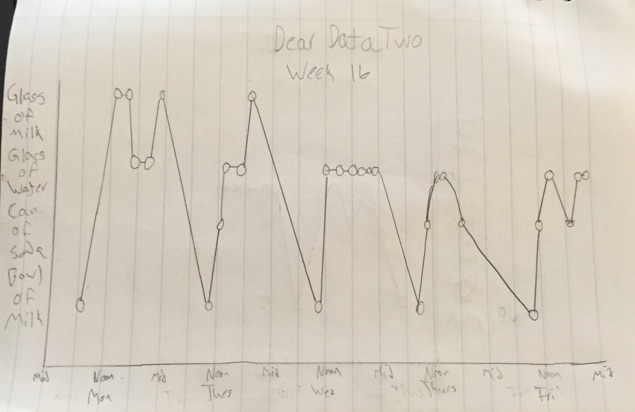
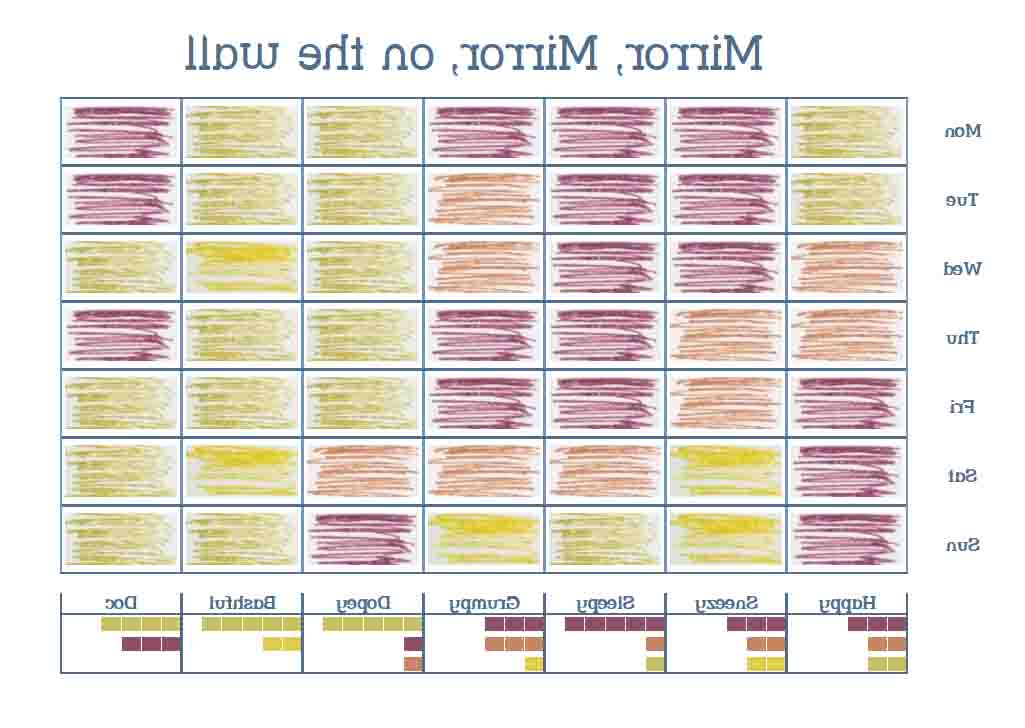
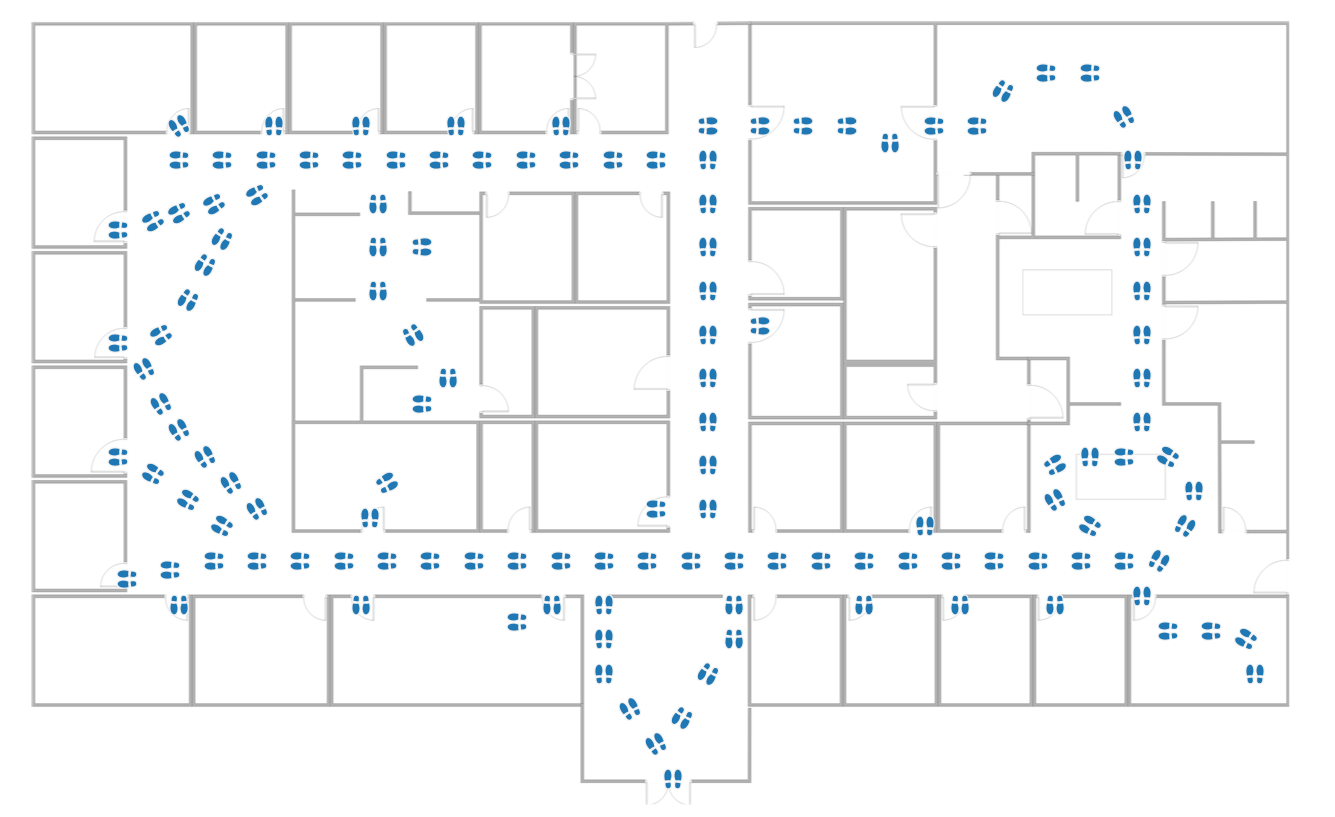
Welcome to Dear Data Two

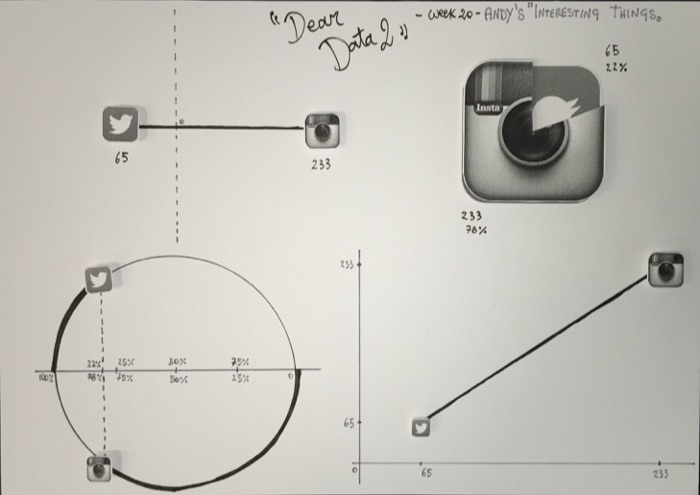
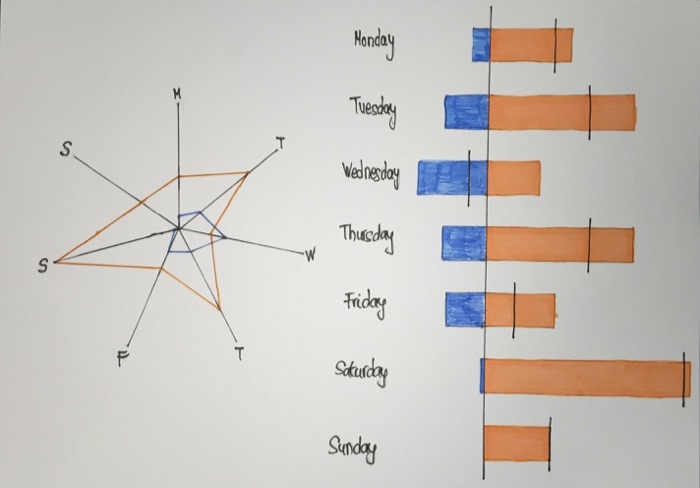
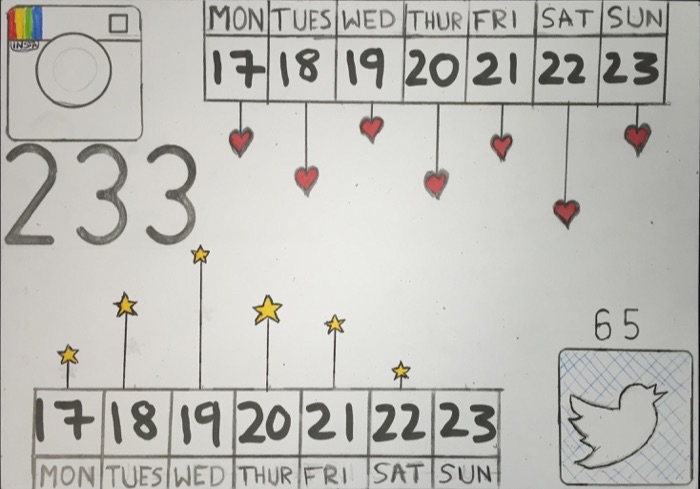
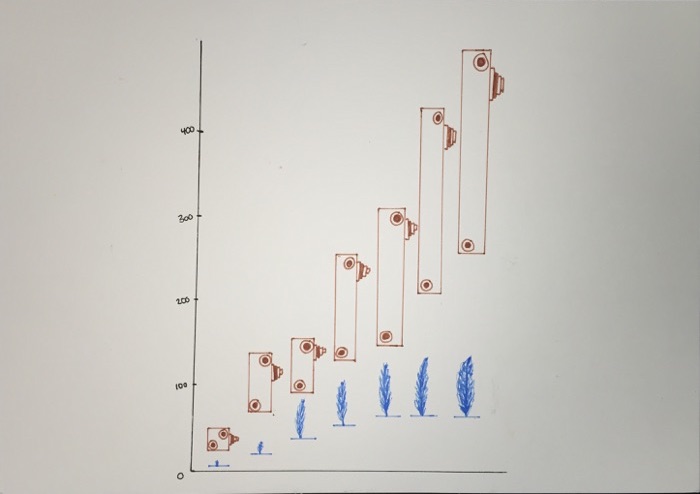
This project was inspired by Dear-Data.com, a wonderful collaboration between Giorgia Lupi and Stefanie Posavec. We (Jeffrey Shaffer and Andy Kriebel) decided to follow in their footsteps and coincidentally, Andy moved from California to London, England.

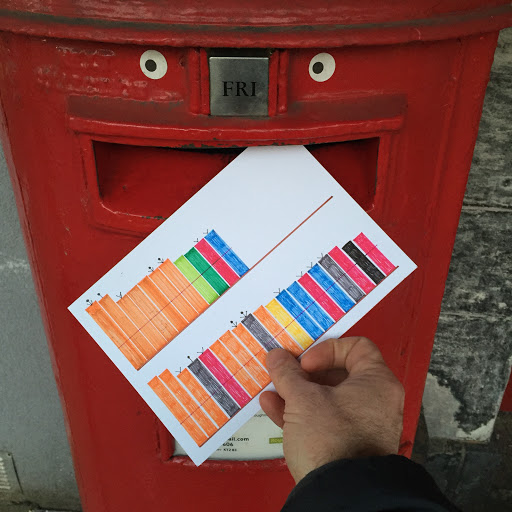
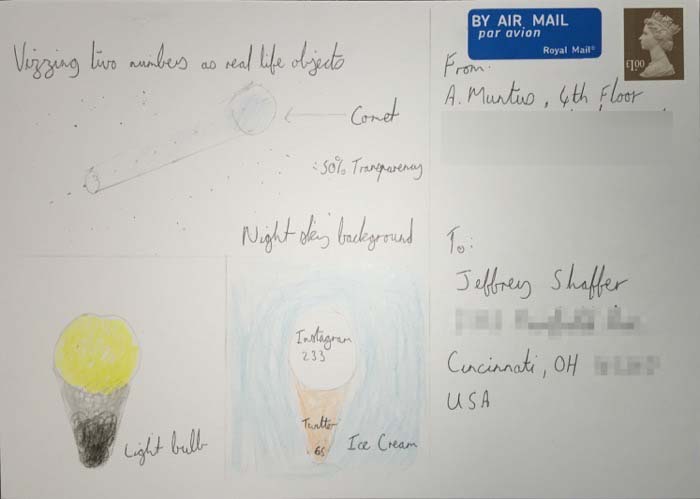
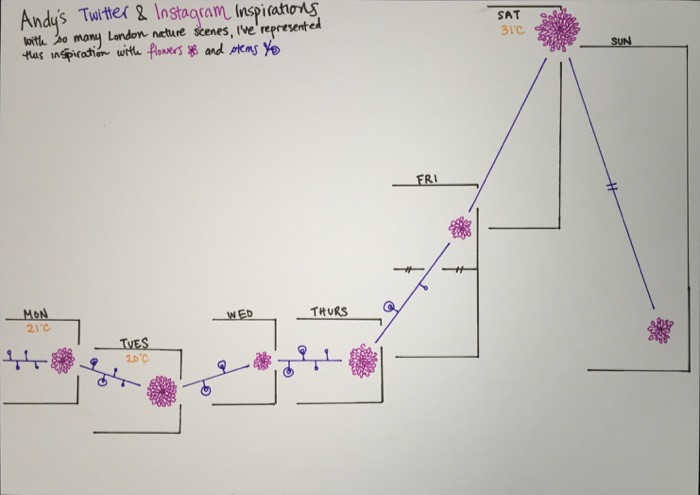
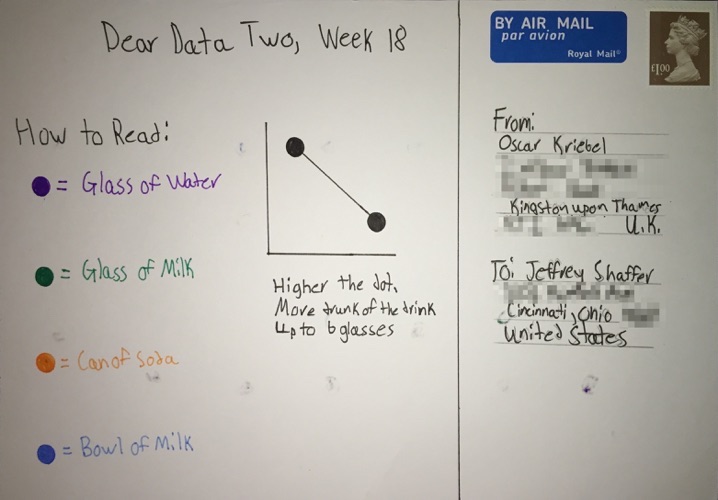
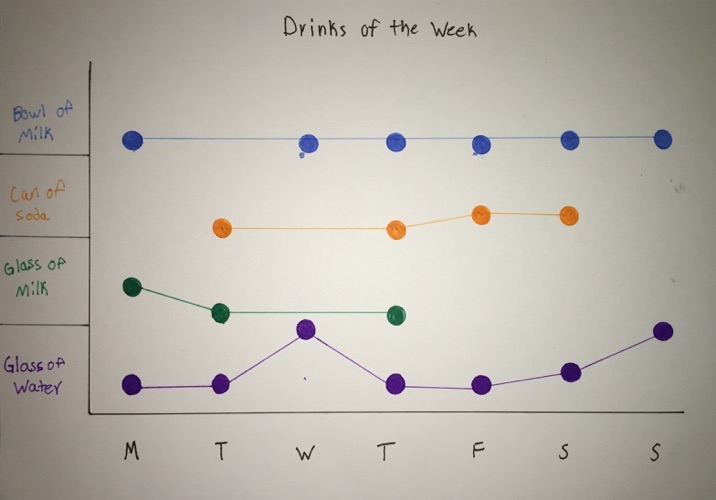
Example pic

It is our intention to follow the original authors, week by week, creating our own visualizations on postcards, and mailing them to each other. We have decided to keep with the same topics as the original project, but in a very broad sense. In the same manner as the original project, everything will be drawn by hand (although we both opted in week 1 to use a straight edge along with our gel ink pens).

We are both data visualization practitioners, teachers and regular speakers on the topic and we are big proponents of data visualization best practice. Giorgia and Stefanie are amazing artists, which is evident in their work. We are technology guys, using tools like Tableau and R to create data visualizations. We thought it would be fun and interesting to see the differences in the approach and design of the data and contribute to this amazing project. We encourage others to do the same.

Thank you for joining us as we explore this project.

Jeff and Andy


Week 52 - Goodbyes


Jeff looked at the statistics of all the data files for the Dear Data Two project:


Notes from Jeff:


It's hard to believe that we are at the end of this project. Fifty-two weeks, gathering data and creating postcards. It's a strange feeling being done with the project. Ever since completing this it seems odd not to sit at my desk and draw weekly data on new postcards, but the end has come.

Interestingly, after completing this postcard, it ended up on a desk in my kitchen, which is where I always put it before going out in the mail. However, the postcard somehow ended up falling behind some other papers on the desk. Weeks went by and I hadn't heard anything from Andy. He just assumed that I hadn't completed it yet. I assumed my wife mailed it, because it wasn't on the desk, and just figured it was still in transit. Then out of the blue, weeks later, my wife ran across it. We were all shocked. Thankfully the postcard was fine, so off to the mail it went, for real this time around. I also made sure to confirm with Andy that it arrived. I had to laugh about it though because of all weeks to have that happen, it had to be the very last week of the project. I joked with Andy that he must have thought I gave up after 51 weeks and just threw in the towel.

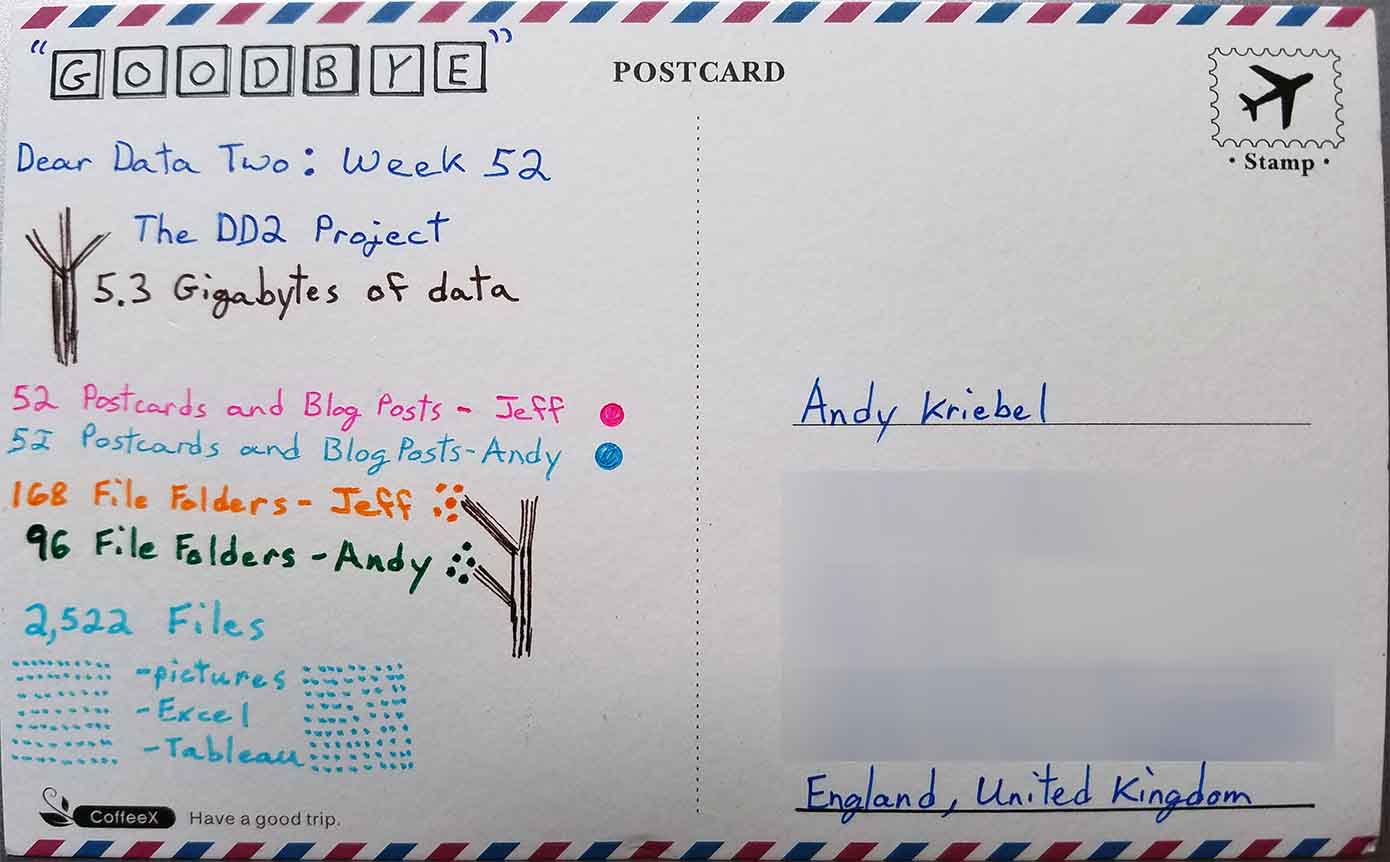
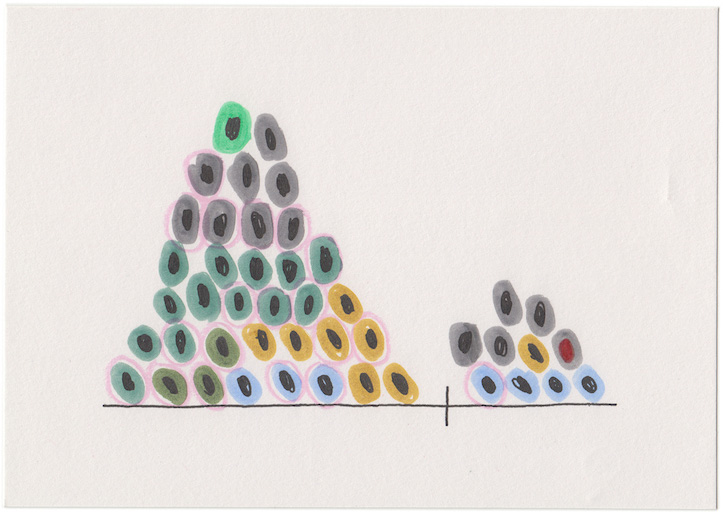
For the postcard, I wanted to visualize the depth of the project. I gathered up some numbers and I was really surprised. It was remarkable to see how many files and the data gathered throughout the past year.

   • 5.3 gigabytes of data
   • 168 file folders (Jeff)
   • 96 file folders (Andy)
   • 2,522 files (images, Excel files, Tableau workbooks)
   • 52 postcards and blog posts each

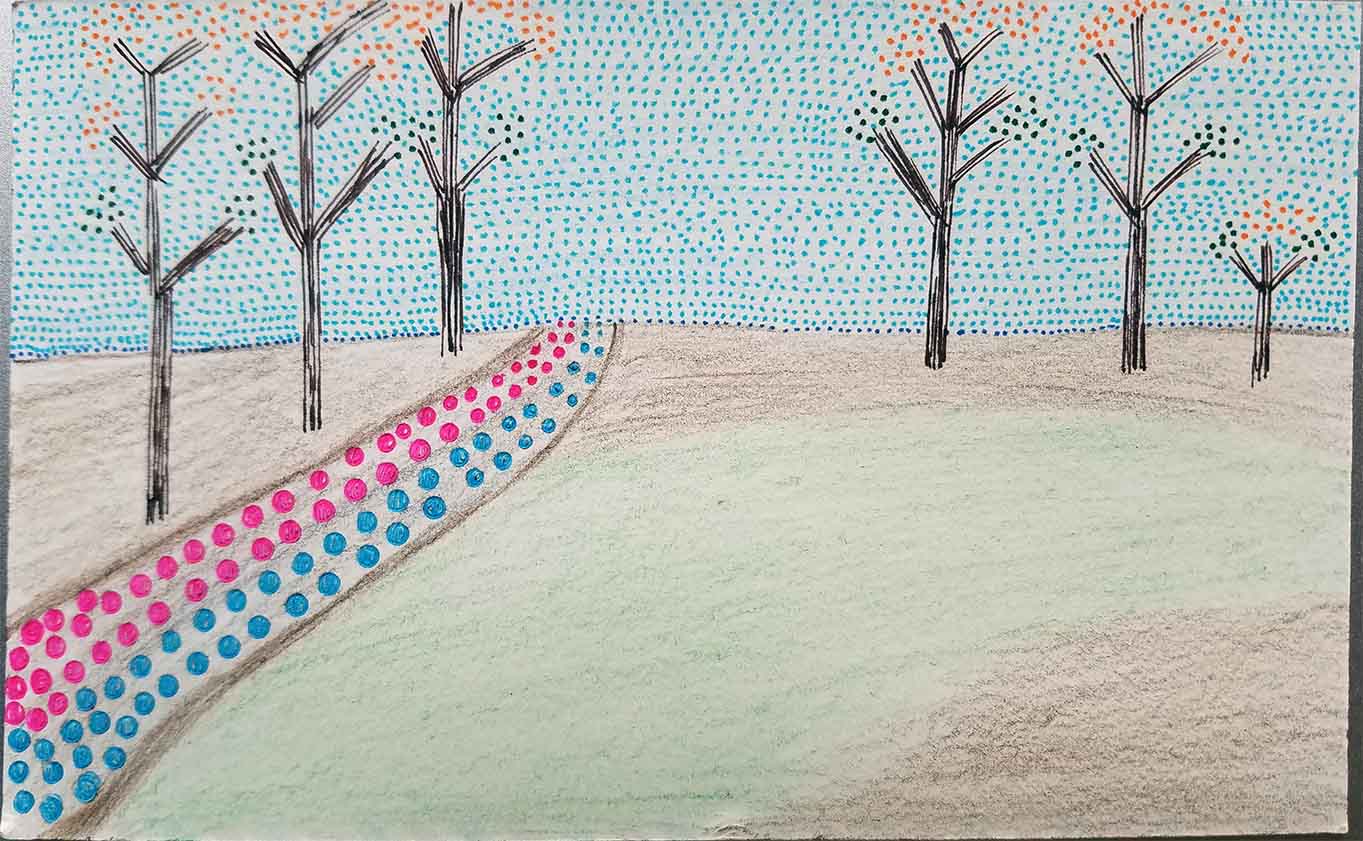
The 52 postcards for Andy and I are shown on the pathway, Andy's in blue and mine in pink. My file folders are shown as orange dots on the trees and Andy's in a dark green. The total of all the files is 5.3 gigabytes, which is represented by the number and size of trees. Combined, we have a total of 2,522 files for the entire project. These are represented as the sky with light blue dots.

As Andy describes, this is a bittersweet goodbye. I feel very fortunate to have had Andy as a partner on this journey. It was great to learn about him and his family. I've learned so much about myself too, tracking and analyzing things that I would never have done without going through this project. I also sharpened skills in so many areas, for example, I feel like I am much more efficient with Tableau and Adobe and I've honed some new skills. I've never considered myself someone that draws, but I can definitely say that I am much more comfortable with sketching and drawing now. This has certainly had an impact on my data visualization work as well.

Thank you all for following us through this journey and I hope you have had as much fun as I have.


Andy tracked his goodbyes throughout the week:


Notes from Andy:


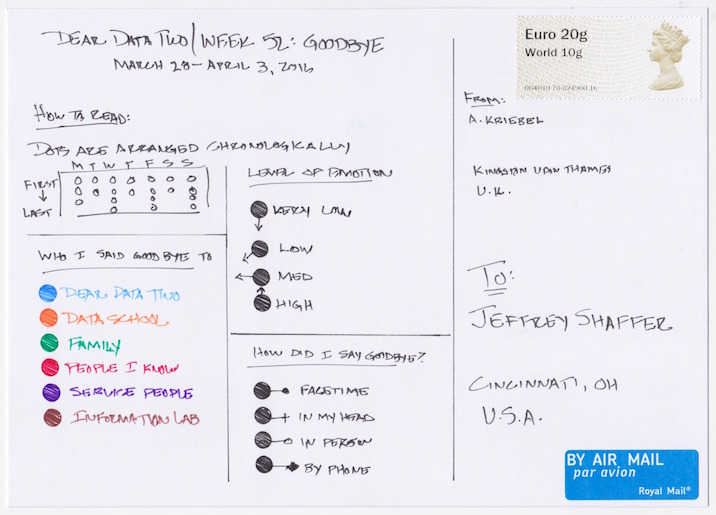
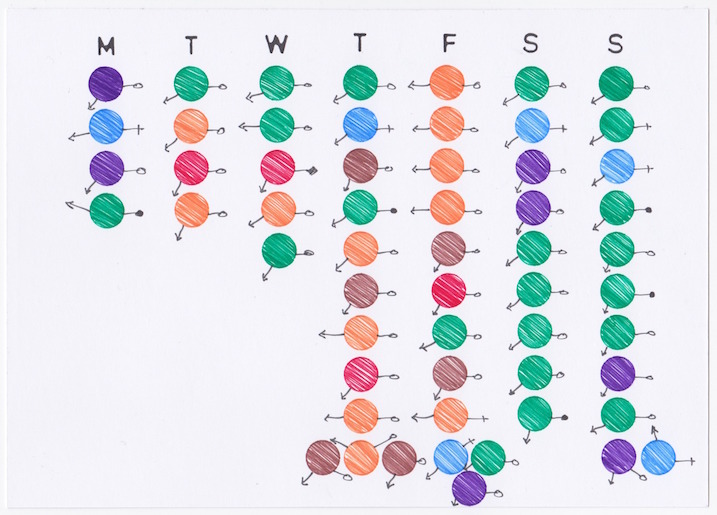
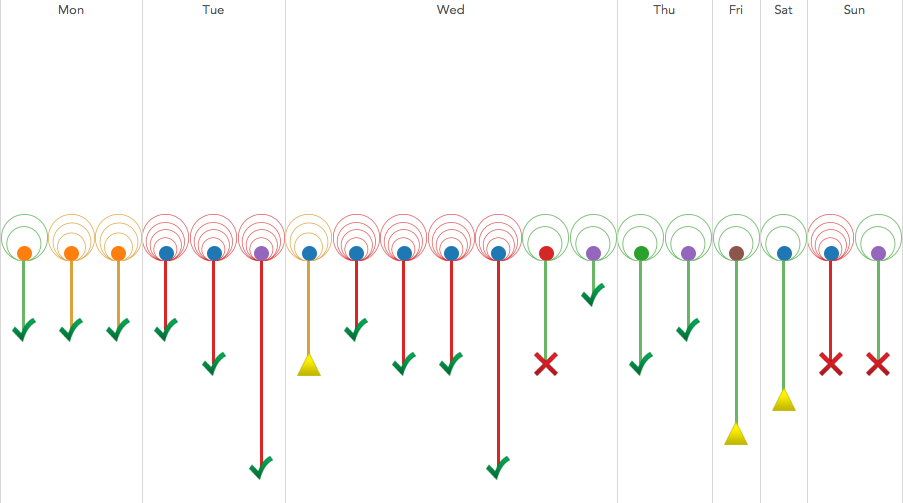
Goodbye - it’s something we say all the time. Sometimes it means “see you soon”. Sometimes it signifies the end. Week 52 of Dear Data Two was all about goodbyes. When do I say them? Who do I say them to? How emotional am I? How do I say goodbye?

The timing for this week couldn’t have been any better. Not only was this the final week for Dear Data Two, it was also the last week for the second cohort of the Data School. I wanted to track my emotions throughout the week to see if anyone or anything triggered me to be more emotional. Unfortunately I never found this out; I rarely got too emotional saying goodbye.

What’s exciting for me is that I know the Data School is ready for their placements. Saying goodbye to them wasn’t about being sad, it was about being proud. Proud of who they’ve become, what they represent, and the impact they’re going to have on the World.

For Dear Data Two, it’s more bittersweet. I’m very excited it’s over. Tracking data about yourself on a different topic for 52 weeks is not easy. Taking that data and trying to understand is even harder. Then I still had to create a postcard, which was BY FAR the hardest part. I’ve grown, and I’ve learned an amazing amount about myself, about Tableau, about Jeff. That’s what I’ll miss.

What I take most from this project is the approach: drawing visualisations makes you think differently. There’s no interactivity, no computer screen, little directions. There’s no way you cannot become better at data visualisation through a project like this.

I hope you all have enjoyed following this project. I hope you’ve learned something about data visualisation. I hope you’ve picked up some Tableau tricks along the way. I appreciate all of the feedback and comments.

I’d also like to thank Steve Wexler for his great blog post on visualising 4-scale survey data. The post was immensely helpful this week and I gladly stole his color palette.

Goodbye!


Goodbye everyone. Thank you for following our project!


Week 51 - Privacy


Andy looked at the data accumulated over the first 48 weeks of the Dear Data Two project.


Notes from Andy:


We are 51 weeks into Dear Data Two and there’s surely so much Jeff has already learned about me. Yet we all have secrets. We all have things we’d like to keep to ourselves. We all do things we’d be embarrassed about.

For week 51, I tracked everything that I would have been embarrassed about. Was it something I did, said or thought? How embarrassed would I be if someone knew? Is there anyone I would share it with? These are the moments I’d very few people to know about. And it was a fun week. I’ve never really thought about all of the things that I keep to myself because I’m essentially afraid to share them.

One thing I wanted to be sure of was to NOT note the specific things I was embarrassed about. I mean, I’m all for open data, but there are some things that need to stay locked away in this little brain of mine. What are some things I found out about myself this week?

   1. I tend to not be embarrassed by little things. Go big or go home I guess! I know this because I tracked how embarrassed I would be if someone found out and rated these on a scale of 1 to 5. My average embarrassment level is a high 3.7.
   2. It’s not my thoughts that embarrass me most, it’s my behaviour. Go figure!
   3. I’m very close to my brother. In fact, he’s clearly the most likely person I would tell if I wouldn’t keep it to myself.

For the postcard, I wanted to incorporate all of the dimensions that I tracked. There are no measures in this data set (I consider level of embarrassment a discrete measure), so that posed another fun challenge…visualizing data with no measures. Overall, another interesting week and only one week to go!


Jeff tried sketching this week:


Notes from Jeff:


So I decided to try something new this week. Yes, 51 weeks in and I'm trying something new. I wanted to try sketching, but I wasn't thinking about sketching in notebook. I wanted to try sketching with an app. So I downloaded an app on my phone and started to play around. I was pleasantly surprised by the response of the app, even with using my finger.

So I gathered up some data and sketched away. It didn't take me too long, just a few minutes and I had sketched my postcard. Was was interesting in this process is that it was actually easier to draw with my finger on my phone then it was trying to recreate what I did on the postcard. The lines with the pen, while smooth, were not nearly as quick and smooth as swiping my fingers over my phone. And the location of the shapes with my fingers super responsive and hard to recreate on the postcard exactly.

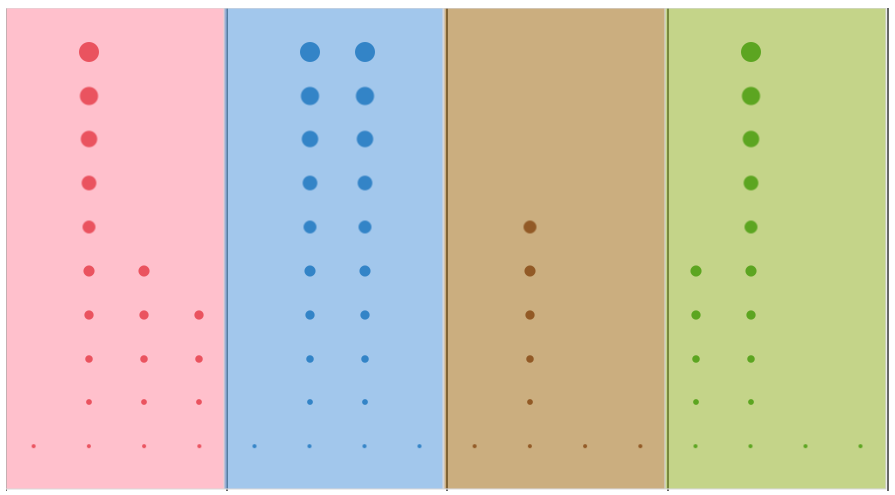
I've sketched out visualizations before, but never like this for the postcard. In past weeks I would have an idea and try sketching on a postcard or postcard sized paper, but my idea was typically formed at that point. In this case, I started with the data and no idea. I just opened up the app and just started drawing lines and dots. Here's the end result, an exported image from the app. My thought at the time was "privacy" and "closed door" would be represented by the lines dividing up the postcard into two separate sections.


Only one week left to post! Stay tuned.


Week 50 - Phones


Jeff examined his photos and vidoes on his new phone:


Notes from Jeff:


I actually got a new phone this week, a Samsung Galaxy S7 Edge, which is an amazing phone. How's that for perfect timing? I remember changing devices 10 years ago and it was such a pain. Thankfully, it's not nearly as bad as it used to be. So much is online now, work email, Gmail, Twitter, Facebook, and even files from Dropbox; all synced up super easy. The only issue I had in switching to a new device was copying over my photos and vidoes into my camera folder. I have backups on Dropbox, but I wanted to get them over to the phone in the same directory so they would be in my gallery. There is a sync option with the phones, but it was going to take days to copy using that. So I copied them off to a computer and then copied to the new phone. So that's where my inspiration and data came from for this week's postcard. I transferred 3,320 pictures and 101 videos.

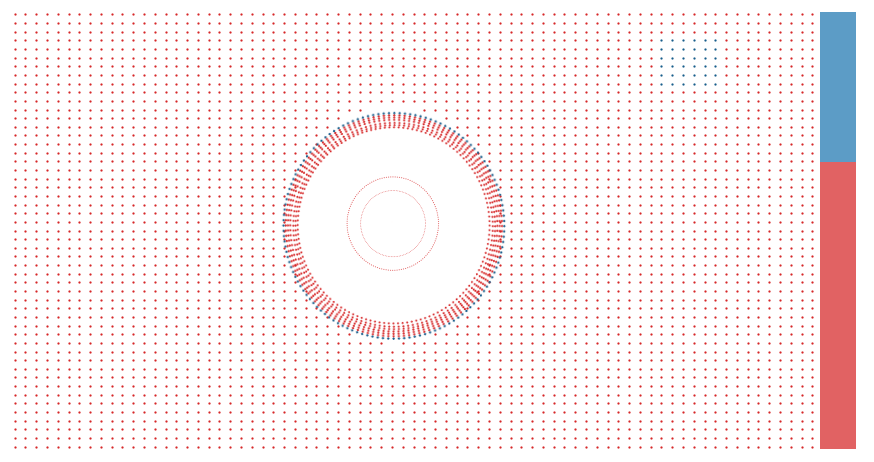
For the postcard, I used a single dot for every file that I transferred. So yes, I plotted 3,421 dots on the postcard. I've done this for a few postcards throughout the project (Week 38 here and Week 40 here). It always seems like a good idea at the time, but then about half way through, my hand hurts and I regret going down that road. In the end, I'm always happy with the outcome, so I guess it's worth it. For this postcard, I created an image of a camera. And how better to express copying over thousands of individual files? The individual dots really tell the story here. We don't need to see precision in this case, we just see it's a crap ton (that's an official US measurement).

This is the first time I've tried to create one of these "thousands of points postcards" in Tableau. One approach might be to use Brian Prestige's technique for turning any image into a polygon posted here. Instead, I recreated this one by just creating and plotting some data for it. The key in doing this is understanding how Tableau works. There are two critical pieces here, first structuring the data. Tableau likes "tall" data, meaning unpivoted data. Second, you need to approach Tableau as a blank canvas. This is at the heart of what Andy and I have learned along the way during this project. Thinking about Tableau as a blank canvas. It's all about plotting points in an X/Y space.

The data started as a column for X and column for Y. I used numbers for 75 columns (1 to 75) and 51 rows (1 to 51) which plots a full rectangle of dots. Once the rectangle was plotted, I then used the selection tool with the radius tool to start at a point in the center and filtered out points to create a small empty circle in the middle (i.e. the center of the camera). Then I added some additional points to the data set all at that center point. I added another field for size, because I knew I needed to plot different size circles for the lens . I found a free image of a circle made with dots and by sizing them from 1 to 25, in various sizes, I was able to get them really close to the postcard. I started coloring the points by selecting and grouping them, but I ended up adding another column for color to make it easier. The last step was building a stacked bar chart and floating it on a dashboard to put it all together.

Note - I did take the time to count the dots on the postcard as I drew them, but I did not take the time to make sure the Tableau viz had the same number of dots. As we used to say in music school, it's "close enough for jazz".

Here's the final Tableau version:


Andy looked at his sleep patterns since the beginning of the Dear Data Two project:


Notes from Andy:


Week 50 was clearly one of the easiest from a data collection perspective as there was really nothing to track. It was a nice break for the daily effort to keep up with each topic. For this week, I wanted to look at the apps that sit on my phone’s home screen.

   • Why did I choose these apps?
   • How do I organize them?
   • What’s the most common colour?

Scroll through the story points below to see a bit more about my phone and get a bit of insight into how my brain works. The last two story points show the postcard I drew. It’s really hard to draw app icons! This took hours!


Only two weeks left to post and next week is Privacy.


Week 49 - Data


Andy looked at the data accumulated over the first 48 weeks of the Dear Data Two project.


Notes from Andy:


At the start of this week, I attempted to follow the lead set by Stefanie and Giorgia during their week 49 and track every time I heard, said or wrote the word “data”. Tracking swear words was difficult enough and I quickly realized there was no way I would be able to keep up with “data”, there’s simply too much of it.

It was Tuesday and I couldn’t really start a new topic because I’d be missing a day. Instead, I decided to look at the data I had created through the first 48 week of Dear Data Two. There are four main types of data I create every week: raw data (usually in Excel), Tableau extracts, Tableau workbooks, and scanned images. As you click through the story below, you’ll see I’ve created nearly 1GB of data through 48 weeks, 95% from pictures.

This means that the data sets I had been working with have mostly been small. And this revealed a problem I hadn’t know: my Tableau extract were actually BIGGER than the raw data. I always had it in my head that Tableau extracts would be smaller than the source data, but in 42/45 weeks, that wasn’t the case.

Some summary stats:

   • 357 pictures = 926.4 MB
   • Raw data = 3.5 MB
   • TDEs created = 3.9 MB
   • TDEs were on average 10% bigger than the raw data
   • 45 Tableau workbooks = 36.2 MB

Overall, it was fun to analyse the data of Dear Data Two. Flip through the story below to see my take.


Jeff tracked a few key data elements for what turned out to be a very interesting week:


Notes from Jeff:


This week I was juicing. My first postcard on steroids. I'll explain.

I was supposed to go to the Tapestry conference in Colorado. I arrived at the airport for my flight, which was scheduled early in the morning. The plane was delayed hour after hour and ultimately canceled. By the end of the day I had to make a quick decision. Am I going to fly out to Tapestry later, missing the opening night and then turn around and come home the following night on a red eye? or was I going to give up? After 7 hours in the airport and not positive on when I would get there, I ended up giving up on the trip and going home. I was looking forward to the conference, so this was really depressing. However, it turned out to be a good decision.

The next morning I woke up at 6am and I couldn't walk, more specifically, I couldn't put any weight on my right leg. I ended up in urgent care that morning followed by 3 other doctor visits over the next 2 days for various tests. They ruled out all kinds of things, but they never figured out what the problem was. I ended up on steroids and over the course of a few days things started to get better. Eventually I was back to normal (about a week later) and I've been fine ever since. It was really strange, but in hindsight, I'm glad I wasn't at the Tapestry conference when this happened. It was also my birthday, which I spent with various doctors and then sitting on my couch in pain with my legs up. Not the best birthday I've had, but lots to be thankful for, since I recovered quickly and all the tests were fine.

For the postcard, I decided to simply list a few key data points. When I thought of data, I thought of binary. So the postcard simply lists the following data points for the week.

   7 hours sitting at airport
   4 doctor appointments
   14 ibuprofen pills
   18 steroid pills
   Happy Birthday!!

There are so many different ways to create this one in Tableau, but I kept it super simple. I placed a text box on a dashboard and put the binary code in a text box. Then I colored the text to match the postcard and I made sure I picked a clean mono-spaced font so the numbers showed up equally spaced (Times New Roman did the trick).


Only three more weeks to post. Next week we look at our phones.


Week 48 - Sleeping


Jeff examined the hours of sleep this week:


Notes from Jeff:


I was a little worried about this week's data set. I don't have a great sleep pattern and I was wondering what this week was going to look like. It actually looks more "normal" than I expected. At least there was some consistency. Had I tracked another week it probably would have looked much worse.

As for the data collections, there wasn't much to it. I simply tracked what time I went to bed and when I woke up. I am rarely asleep before midnight, which is evident in this week's data. There was only one night where I went to bed right around midnight. The other nights it was later. Also, the older I get, the less I "sleep in". However, I wouldn't describe myself as an "early riser" either. This week was pretty steady around 7am-7:30am, which is pretty normal.

I visualized the time on a clock. The postcard actually looks like a series of pie charts, but that's not actually the case. It only shows 12 hours of a day and therefore does not represent a percent of the day. It's simply the shaded time on the clock from the time I went to bed until the time I woke up.

Creating in Tableau was pretty easy since I had already done a post at the end of last year about visualizing time on a clock here. I simply added the large letter Z as an image and then plotted the clocks and put them together on a dashboard. The only tricky part was getting the pink border around the circles. To do this in Tableau, I used a dual axis and removed the pills from color on the second axis, made the color white with 100% transparency. This created a blank pie chart. Then I simply added a pink border around it.


Andy looked at his sleep patterns since the beginning of the Dear Data Two project:


Notes from Andy:


For week 48 of Dear Data, Giorgia and Stefanie focused on eavesdropping. Tuesday came along and I had no data. So I reached out to Jeff and he was struggling with the topic as well. We punted and decided to look at our sleep. We hadn’t had this as a focus yet, so off we went.

The data collection for me was pretty simple. I logged into my Fitbit account and downloaded all of my sleep data since Dear Data Two started. I complain about my sleep to Beth on a regular basis and she’s convinced that I don’t sleep well because I think too much about not sleeping well and overanalyze my sleep data. Surely there’s some bit of truth in there, I mean, wife knows best, right?

Here’s what I learned this week:Flip through the story points below to see more about what I think about my books and to see the postcard.

   1. I need to get more sleep.
   2. Tableau conferences are absolutely horrific on my sleep (and I know I’m not the only one).
   3. Sleeping while on transcontinental flights will always result in poor sleep efficiency.
   4. I rarely ever hit my sleep goal during the week. Clearly I need to get to bed earlier since I wake up early.

Below you can walk through my analysis and see my postcard. Enjoy!


Next week we look at data and only four more weeks left to post!


Week 47 - Smells/Scent


Andy examined the exotic(?) smells of London. Also, notice in his notes, he has been converted in his spelling of the word "colour". I think he's been in London a bit too long.


Notes from Andy:


Let’s get straight to the point…London, you stink! Between your smokers, your trash, and your stinky commuters you need to slap on some deodorant!

For week 47, I tracked every smell or scent that I really noticed. Clearly other London smells really bad or I only notice the bad smells. How can only 1/3 of the things I smell be positive? Really, I think it’s that there are so many smokers that sets me off.

On the positive side, 85% of the food I smelled was nice. But dang, that stinky fish someone was cooking in the office was god awful. Why would someone microwave salmon? So gross! I went down to Brighton for a half marathon over the weekend and, not surprisingly, I really enjoyed the smell of the sea, the fresh air, the not-so-polluted part of England.

For inspiration this week, I looked at Giorgia’s postcard.


Her shapes reminded me of noses, so I found a nose icon and created a panel chart view, which I think turned out quite nice. This was definitely what I wanted to take over to the postcard, yet there was no way I had the talent to draw 45 noses. Off I went to the stationery store to look for a stencil. I couldn’t find a nose stencil, but I did find a cool 3D stencil. So I created 3D ovals and added a bunch of other information for context.

Fortunately Jeff isn’t colourblind, so I stuck with a red/green palette to signify good vs. bad smells. Flip through the story points below to see how my week turned out.


Jeff looked at the smells throughout his house:


Notes from Jeff:


This week I looked at the various smells throughout the house. My wife has a super sniffer, so I thought about asking her to track smells during the week, but I decided to keep the focus on the smells I smelled. We have lots of great smells permiating in the house at times. There are kitchen smells, food cooking or my wife's coffee in the morning; all really good smells. I also have three dogs, so there are often some not-so-good smells at times. However, while these are the first things I think of when I think about smells, they really didn't stand out this week. My wife's perfume and essential oils stood out and my girls frsh clean hair. I think my favorite was the incense that my wife burned in the evenings in our living room. That was very relaxing and smelled really good.

On the flip side, there was a single source of the bad smells this week, my daughter's feet. Nina had some stinky feet. So her feet and her shoes were the only thing that stood out. Thankfully her shoes were away, but there were times when her feet were so bad that I made her go and wash them. We've since started using some sneaker balls and that has helped a bunch.

For the postcard, I used the Chinese character "xiang", which means fragrant, scented or nice smell. I have no idea what made me think of this and I have no experience at all in writing Chinese characters, so I hope it's written correctly, otherwise I might be saying something completely different.

When I thought of smells, the idea of "bursts" came to mind, so I drew color bursts to represent the smells. The final postcard reminds me of fireworks going off, so I hope the idea of bursts of smell came through. To recreate in Tableau, I used an image of the Chinese character and then plotted some radial bursts around it, coloring them to match the card.


Next week we examine our sleep, our more accurately, our lack of sleep.


Week 46 - Books We Own


Jeff examined the books on his bookshelf in his living room this week:


Notes from Jeff:


I looked at the books on my bookshelf in my living room. I have other books throughout the house, but these books are the books I use the most and so I keep them handy and nearby. They are mostly books about data visualization and data mining, with a few others sprinkled in. I don't really read books other than to learn, so I never read fiction and I only read non-fiction if it's a reference book, technical book or a book relating to a specific topic of interest. I hardly ever read history books, biographies or other stories.

My collection of books on data visualization and data mining is pretty extensive. I own most of the books on the topic of data visualization, and some of them I even have multiple copies. Sometimes an author will send me a copy to review and some I have multple editions of the same book. They don't really fit on two shelves anymore, so they are packed in pretty tight. There are a few that are horizontal and recently they have started to bleed over onto a third shelf.

My girls helped me collected the data. I used Excel and each of my girls collected the data for one of the shelves. They read me of the color of the book and then measured the book's height and width in inches (I mistakenly wrote weight on the address side of the postcard instead of width). I recorded this and then used that data to create the card, using bars on a shelf to represent the books height and the color of the bars to represent the books color.

I used a brown postcard this week because my bookcase is brown and also because it allowed me to use a white marker on the card for books that were white. As you can see, there are a great many books that are white. Creating this in Tableau was super easy. I used height of the book on y-axis, width of the book on size and the color of the book on color. I created a sheet for each shelf and also for the books that were sideways on the shelf. Then I just put them together on a dashboard.


Andy tracked similar things about his book, but he also examined the number of pages and how much he read of the books:


Notes from Andy:


For week 46, the topic was books we own. This feels like the first week in a while that I haven’t had to really keep up with logging data on the fly. I simply took my computer to the bookshelves around the house and entered the titles of the books. From there, I searched for each book on Amazon to get the author, pages, physical size and category.

When I started exploring the data, the first thing I noticed was that I was missing a lot of books, especially many of my data viz books. They must be in a box somewhere because there’s no way I would have left them in storage in California. Anyway, I digress.

For the books that I actually have, I have at least cracked the cover on all of them. I was really surprised at how many I haven’t finished. With data viz books, I don’t generally read them cover to cover. I flip through them and read the bits that I want to learn more about. But still, I haven’t even made it completely through so many of them.

For the fiction books, which I used to read a ton of, the average page length is 592 pages, whereas it’s 168 for those I have read. Perhaps it’s harder for me to concentrate long enough to read an entire book. I wonder how true that is for other people. Is it a sign of the digital, fast consumption age we now live in? On the postcard, I placed the books on two shelves according to whether I read them or not. I then ordered them by their physical height, marked them as either read or unread, then went through and thought about which books I would most likely recommend and which books I refer back to often.

As I finished the postcard around 6pm, it was started to get dark, so I ran down to the postbox so I could get a picture and the postman had just taken the mail. He graciously waited while I took a picture of me dropping it in the post (for Instagram). We then got into a discussion about to googly eyes on the postboxes. Apparently some of them even have noses!


Flip through the story points below to see more about what I think about my books and to see the postcard.


Next week someting smells funny!


Week 45 - Apologies


Andy looked inside himself and examined the opportunities that he had to apoligize:


Notes from Andy:


Apologies - something I’ve always struggled with. I know I should apologize more and be more sincere when I do. So when week 45 rolled around, I saw it as a time when I could make a change. Week by week, Dear Data Two has made me more conscious of my behaviour and surroundings. Going into this week, I really wanted to make a change in my behaviour, but I feel that I failed.

Through the week, I only recognized 18 times when I had the chance to apologize. That doesn’t feel like many to me, but maybe it is. Of those 18, I only apologized in person nine times. I resorted to sending a digital apology five times (so impersonal and insincere) and three times I didn’t apologize at all, keeping the apology in my head, fully aware that I had a moment in front on me that I could take advantage of.

I immediately knew that I wanted to create a bump chart both in Tableau and for the postcard, but I struggled with this more than I thought I would. I ended up creating the data needed to rank the dimensions in Excel instead of spending too much time on the table calculations. I added a parameter so I could pick the dimension I wanted to color the lines by. Click on the image to interact with the Tableau version.


Jeff looked into his past and visualized two of his biggest apoligies:


Notes from Jeff:


We've all done thinds we aren't proud of and when the topic of apologies came up I knew what I wanted to show, two big apologies from my past. In high school, I broke off two relationships with two girlfriends, who I will just referene as K and L, and in both cases I handled it very poorly, and that's saying it kindly. Frankly, I was a real jerk in the way I ended both relationships. Looking back, the only thing I can really say about it is that I was young, immature and stupid. Still, there was no excuse. I could have and should have handled it all in a different way. Fast forward into adult life, after being married and having two girls of my own, I can't imagine how I would feel as a dad if someone treated my girls like I did and how my actions must have made them both feel.

Life moved on, I went off to college and then started working, but thanks to advances in technology, mainly social media, I had the opportunity to connect with both of them later in life. When I came across each of them, I took the opportunity to reach out. The first wsa in 2008 and the second in 2010. I sent them an email and apologized. They were both very gracious in their communications with me. I wonder if I would have been as gracious.

For the card, I examined the words that I used in my email to them. The text was similar, using lots of the same key words. There is a dot for each word and large colored dots for the key words. What was surpising to me was how short the apology was. In both cases I traded additional emails as we caught up on life and family, but the apology itself was really not very long. That was sobering. I guess in the end, it's not the length that matters, but the words themselves and the sincerity of the apology, so the key words seemed what was important.

I've never really discussed this with anyone, so doing a postcard on the topic brought back lots of memories of my high school days. Thankfully, two wonderful women were very gracious about accepting my apology.


Next week we have something a bit lighter: Books We Own


Week 44 - Distractions


Jeff looked at how distracted he was each day of the week:


Notes from Jeff:


Look Squirrel! I have 3 dogs and 2 kids, so really, sometimes a squirrel really is a distraction in our household. For this week I looked at the overall day and how distracted I was throughout the day. As it turned out, I was pretty focused, but for Tuesday and Sunday. Tuesday was mostly work issues, fire drills and random things that kept coming up and pulling me away in different directions. Sunday was mostly a family day and I was clearly not focused that day.

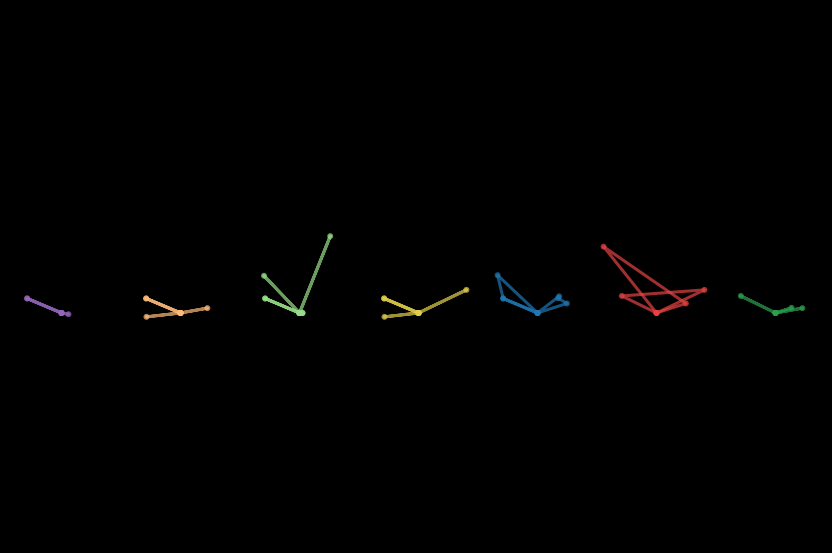
I used sin waves to show the distractions. The continued balance and evenness of the sine waves came to mind as the rhythm and steadiness of attention and then the major shift for the distraction. I made a few attempts at drawing them, which was harder than I first thought. After a few attempts I achieved the result I was looking for. I used the black postcard again, which I've now used a few times before. I chose the colors that I like for the black postcard, which jump out much more than other colors.

This one was fun in Tableau. I used a few basic math equations in come calculated fields. This wasn't anything too complicated. Using X in increments of .1, I applies the function sin([X]) to get the normal days and used cos(sin([X])) for Tuesday(purple) and Sunday(light green). I offset them a bit with a starting and ending position and with a few minor adjustments I was able to get the lines really close to the original without too much trouble. Snagging the color was super easy using the Tableau screen color pick tool.


Andy tracked four different elements of how he was distracted:


Notes from Andy:


For week 44, I tracked all of the things that distracted me. The data I collected included"

   1. When did I get distracted?
   2. What was I doing at the time?
   3. What distracted me?
   4. How long was I distracted?

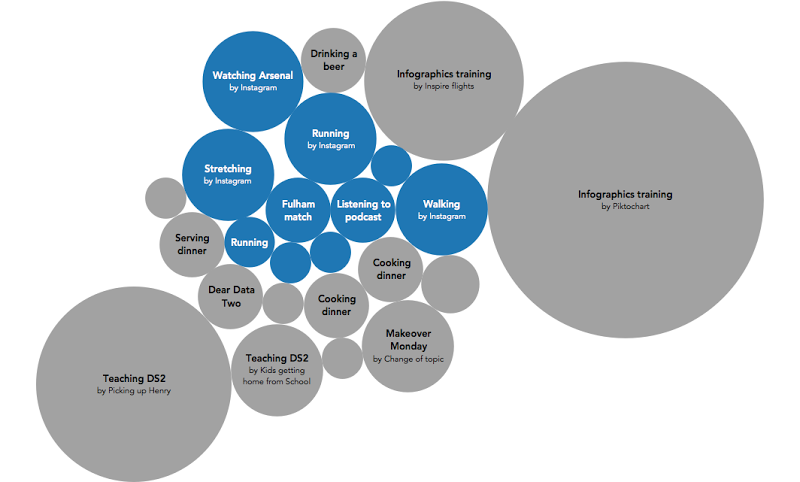
When doing the analysis in Tableau, I started doing what I always do by building lots of different views. I started with how many, but there weren’t any days that were massive outliers. When looking at how long I was distracted, there was a big outlier on Wednesday. That was because we had Caroline Beavon teaching in amazing data visualisation class at the Data School and she introduced us to an infographics design tool called Piktochart. This is when I distracted myself. It was fun to play with and got me thinking more about design.

I built several more views looking at the different dimensions against the different measures. Nothing particularly exciting…until I built a bubble chart in which I colored the bubbles by whether or not social media was the distraction.


I generally have a disdain for bubble charts, but this particular view helped me easily see how often social media is a distraction. Does this mean I’m on my phone too much? Probably!

The view above simply looks at how often, meanwhile looking at the bubble chart by how long the distractions lasted makes social media distractions look not so awful.


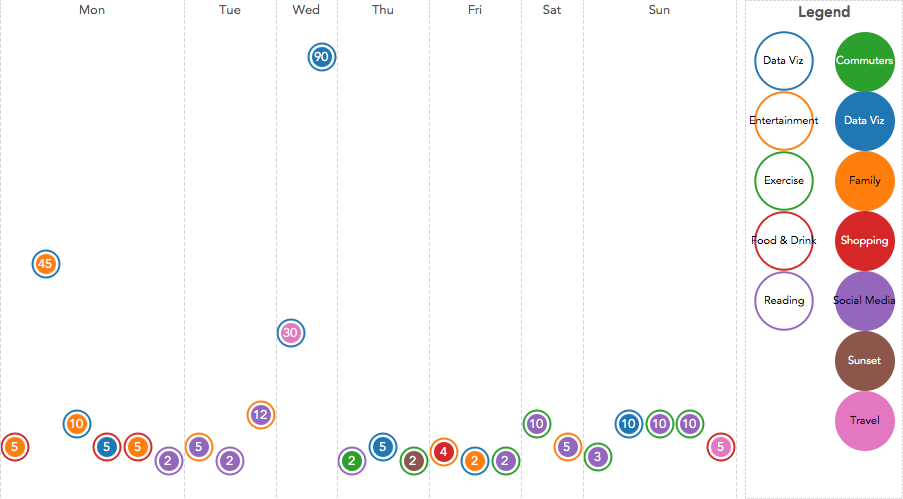
Lastly, I needed to find a view that would allow me to incorporate all of the dimensions along with the length of each distraction into a single view. I came up with this viz:


Here are some of the design decisions I made:

   • Show the day of the week left to right
   • Inside each day, show the distractions in order from first to last going left to right
   • To show what I was doing and what distracted me, I wanted to go with the idea of going from something to something else. I ended up with filled circles inside open circles. The open circle is what I was doing; the filled circle is what distracted me.
   • Create groups of activities and distractions so that there aren’t too many colors

Lastly, I liked what Stefani did for her week 44 with the lines, so I tried to do something similar with my postcard version while maintaining the view I created in Tableau.


Next week we will be apologizing.


Week 43 - Trying New Things


Andy tracked data for the week on things he tried and whether he liked them or not:


Notes from Andy:


I’ve fallen behind…again! I was in quite a good groove, then suddenly burnout hit me. Fortunately I’ve been able to keep up with the data collection. The ebbs and flows of this project can become quite overwhelming and I’d rather hold off on creating a postcard until my head is in it than create something for the sake of staying on track. I’m fairly sure Jeffrey feels the same way.

I feel like I’m in the home stretch now. Currently I’m collecting data for week 47, which means only five more weeks!!!
For week 43, the topic was “trying new things.” Immediately I thought about when I was a kid and never wanted to try new food or go new places. As an adult, I’ve become quite more adventurous, including two massive moves for my family, so I think I’m adapting well to trying new things. You can read through my analysis of the week in the story points below. The simple outcome is this: I liked 81% of the new things I tried, so that should encourage me to try even more new things and to not be afraid.


Jeff plotted an analysis of his website, which was newly launched this week:


Notes from Jeff:


So "trying new things" just happened to be the topic the same week as I launched my newly designed DataPlusScience.com website. I decided to plot the traffic on my website during the timeframe of the Dear Data Two project. I was able to get good tracking details from Google analytics. Also, for this week I approached the postcard in the way Andy does each week, exploring in Tableau first. I brought the data into Tableau using the native Tableau data connector for Google analytics.

I used a dot plot with jitter with each dot showing the total number of pageviews for that specific day of the week for every week in the time period. I added a line chart on the bottom to show the trend over time. It was really easy to see the pattern of weekdays vs weekend days. Clearly people are visting the website during the work week much more than on the weekends. I used an orange dot to highlight this week. The launch of the new website has driven lots of traffic, reaching new record highs on a few days.


Next week: Distractions


Week 42 - Laughter


Jeff looked at how ticklish his family is on certain parts of their body:


Notes from Jeff:


I decided to try something different for this week. I decided to see how ticklish my family is, so I engaged my girls in the data collection for this week. We decided on a few key parts of the body and gauge how ticklish they are. Elle looks to be the most ticklish in the family and I'm the least ticklish. It also truns out that the arm pit was the most ticklish spot for the entire family.

I used dots to plot the intensity of how ticklish each person was and used a background color to identify each person. Creating this in Tableau was pretty straight forward as well.


Andy tracked different elements of his laughter throughout the week in an emoji:


Notes from Andy:


I couldn't wait for this week to come around. We laugh A LOT at the Data School so I knew data collection would not only be easy, but fun too. I also have this weird way of making fun of people as a way of showing that I like them or that they are a friend.

For my analysis, I only considered laughing that occurred at the Data School, which means data is only through Thursday as we had a company trip the rest of the week.

I collected a few characteristics about each laugh:

   1. When
   2. Who was I with
   3. What was I laughing about
   4. How big was the laugh

From there, I started my analysis, focusing mainly on Lorna's accusations that I pick on her too much. What you'll find in the analysis below is that it looks like I laughed AT Lorna way more than I laughed WITH her. However, once I created the postcard and included what we were laughing about, it's evident that I was often laughing at someone else, not her.

In the end, I wanted the postcard to look like an emoji, so I built an emoji view of all of the laughs in Tableau first before creating the postcard. What I like about the postcard is that I gave me the opportunity to incorporate more information and more detail into the final product.

Overall, a very fun week!


Next week we look at Trying New Things.


Week 41 - Music


Andy explored various aspects of the music he listened to:


Notes from Andy:


Music was probably the easiest from a data collection perspective so far. In week 32, I tracked everything I listened to, so I didn't want to do that again. Inspired by Andy Cotgreave's great post about his music trends I thought I would do an analysis on the music that's in my iTunes playlist. I've never thought about looking at the type of music I listen to, how long songs are, nor the bands and their songs that I prefer, so this provided me with the perfect opportunity.

This time, I started my analysis in Vizable and after a few minutes I had a good feeling for the overall patterns in the data.


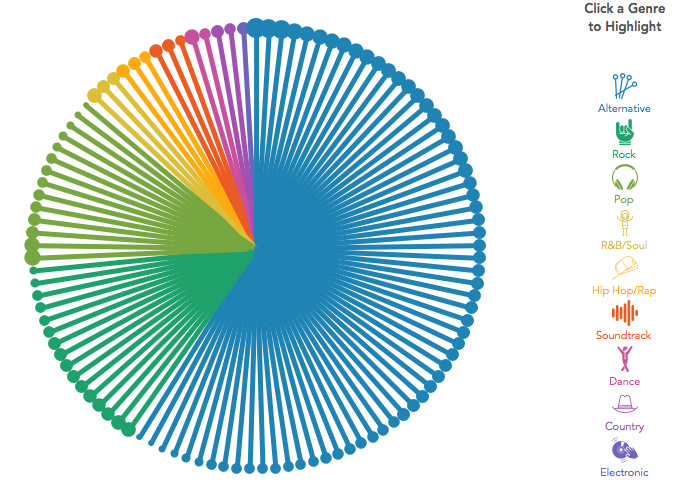
Using Vizable this way definitely helped speed up my analysis in Tableau. I like how Vizable keeps me from overthinking the analysis. It encourages me to play rather than overdiagnose. That being what it is, I was quite surprised to learn how much alternative music I listen to. I suppose that goes back to when I was in college and that genre first became more popular.

I also had a playlist of the songs that are in my primary running playlist, so I used that throughout the analysis as well to help me see if what I listened to in general was the same music I listen to when I run.

For the final visualisation, I accidently created this radial pie chart thingy. I would never create something like this if it weren't for this project. I consider this more "data art" than data visualisation.


Click through the story below to see how I conducted my analysis and to see the postcard I created.


Jeff created a song based on the data collected from his massive CD collection and included a game he played with his girls:


Notes from Jeff:


Music? Where to begin. Those of you that know me probably know that I was professional musician when I left college. Having studied music for my undergrad and first graduate degree, music is clearly a passion of mine. I also married a professional musician, a soprano, who still performs regularly and is also an adjunct professor at the University of Cincinnati College-COnservatory of Music. So when this topic came up, well, I had all kinds of ideas.

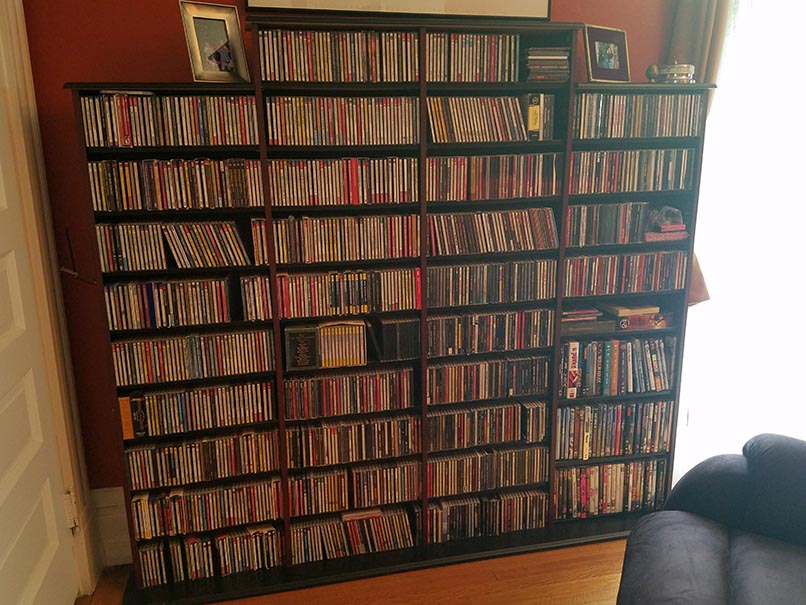
Ultimately I turned to my giant CD collection. It takes up an entire wall in my house. I've collected CDs for almost 30 years. The collection is heavily skewed toward classical music, but there are all kinds of CDs from all different genres of music.

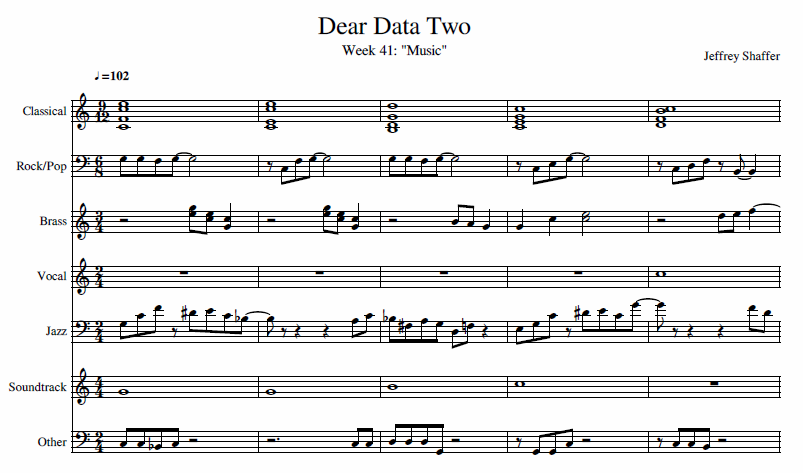
I decided to visualize my CD collection through music, so I composed a piece of music. First, I counted my CDs for each genre of music. Then I created a staff for each genre and wrote the music for each line to match the genre, the notes representing the number of CDs. The piece is written for standard clefs and in standard 4/4 time signature, but for the card I used the first letter of the genre and for the time signature I visualized the results of a game I played with my girls.

The game was based on an exercise that we have to do in music school called "drop the needle", which is a reference to records on a record players where there is a needle that can be dropped anywhere on a record (I do remember these as a kid, but they used CDs by the time I was in music school). For the game, I had my girls pick out CDs from each genre and play them them on the CD player, without letting me see which CD they picked. Then I would try to identify the music, the name of the piece and composer for the classical music, or the song and singer of other genres. The top number of the time signature is how many I identified correctly and the bottom number is how many my girls played in that genre. As an example, in the classical genre, I was able to identify 9 out of 12 correctly. If anyone questions how secure this experiment was, just know that I offered to pay my girls 50 cents each for every CD that I could not guess. So they were very careful not to let me see the CDs they picked and eagerly awaited my answers. In the end, the game cost me $12. They played a total of 40 CDs and the experiment took about an hour and half to complete.

I tried to write the music so that it matched the style of the genre in some way. The classical genre, with most of the CDs, has all of the chords. The CDs of brass music have little fanfares and the jazz CDs are represented with a jazzy bass line.


Click these links to hear the music:
   Classical and Brass sections together
   Jazz and Pop sections together
   Everything together


I also compiled the detailed results of the "Drop the needle" game into a PDF documet here. It turned out that I did the best on soundtracks, identifying 4 out of 4. Being a huge James Bond fan, I was able to identify the Golden Eye soundtrack in the opening 4 notes. In fact, I identified all of the soundtracks very quickly. In addition, on three of the classiscal pieces I was able to identify the orchestra. The one I was most proud of was identifying the opera Little Women by Mark Adamo. I've only heard this opera two times, both live performances when my wife was singing the role of Beth.

Also, you might be wondering what the total count of CDs is in our music collection. I didn't actually count the total CDs. My CDs are organized by the categories that I chose and in alphabetical order so that I can find things. I counted the shelves by genre and apromiximated the number of CDs per shelf based on a few shelves. I also have other CDs in other places around the house and vehilces. That said, here's the data behind the postcard for those estimations:

   Classical = 570 CDs
   Rock/Pop = 228 CDs
   Brass Music = 152 CDs
   Jazz = 76 CDs
   Vocal Music = 76 CDs
   Soundtrack = 76 CDs
   Other = 76 CDs
   Not Counted = 200 CDs (estimated)
   Total Shelves = 33
   Total estimated CDs = 1,454


Next week: Laughter


Week 40 - Meeting New People


Jeff looked at his followers on Twitter:


Notes from Jeff:


I don't meet too many new people in a week, especially this week, and Andy was having the same issue. So we decided to look at our Twitter followers for the week. To track my followers I set up a Twitter ad campaign and promoted a few tweets. To visualize this I drew a Twitter bird using black for my existing followers at the beginning of the week and a blue color for the new followers.


Andy setup an IFTTT to track his followers:


Notes from Andy:


For week 40, meeting new people, I was really hoping that I would meet a ton of new people like Stefanie and Giorgia did when they collected data for this week. I even tweeted out that I would buy people coffee, but I had no takers and didn't meet anyone new through Tuesday.

I reached out to Jeff and told him what was happening and I came up with the idea of looking at my new Twitter followers this week. I believe Jeff is going to do the same. I then set up an IFTTT channel to log new followers to a spreadsheet so that I could start my Tableau analysis.


Next, I looked at when they started following me. The IFTTT channel logs in my local time, which i then broke down by AM/PM.


I didn't have very much metadata to work with otherwise this week, so from this points, I focused on different ways I could visualise my postcard in Tableau.

Click through the story points below to see my brief analysis and my different postcard options. The last tab has the actual postcard for Jeff.


Next week is Music.


Week 39 - Beauty


Andy tracked the beauty that he saw around him day by day:


Notes from Andy:


Last week I tracked the rather depressing topic of negative thoughts, so it was great to turn the page this week and begin taking in the things around me that I find beautiful. I started the week tracking every little thing I found beautiful, which made the data collection overwhelming. So I stepped back and decided to only track those things where in my head I said "Wow! That's stunning!"

This week really helped me appreciate the exceptional beauty that is around me every day, whether it be our wonderful parks, the people I see, or the amazing architecture London offers. I had this week off from work, so I was able to spend a lot of time with my family going on walks, visiting museums, playing games, etc. So the topic, combined with the time I spent with my family, really made for a wonderfully positive week after a rather crappy Christmas week.

My analysis of the data started much like every other week: exploring what each dimension I tracked offered, looking for stories, trying to find patterns. I didn't learn a whole lot about myself, but trying to emulate what Giorgia did in her postcard for this week helped me continue to learn about using Tableau as a drawing canvas.

The trouble I run into time and time again is that I have so many dimensions that I want to put in a single view, but if I add them all in Tableau, the view quickly becomes impossible to comprehend. However, I'm really beginning to appreciate the freedom that drawing on a postcard gives me. I can incorporate as many dimensions as I'd like through the use of symbols and marks in a way that doesn't clutter the visualisation and aids in understanding.

I'm not sure why, but I feel like I'm starting to grow as a data artist, particularly when it comes to pen and paper. My ideas are flowing at the moment. Let's hope I can continue the momentum for the remaining 13 weeks.

Explore my week below by click through the story points. Enjoy!


Jeff examined the beauty around him and incorporated a few past techniques into the card along with some new ones:


Notes from Jeff:


Before I even started this week's topic of beauty, I knew I wanted to create a "beautiful" card. That's a bit hard to define, but that's kind of the point of this week's topic, looking at beauty through our eyes. So the first step was thinking about all of the beautiful things I saw. This week was the week immediately following Christmas, so there were some very specific things that I saw after Christmas that caught my eye.

During the Christmas holiday, my wife puts out a painting of an old truck in the snow that has blinking lights. It sits prominately in our living room and reminds us of my father's 1954 Ford F-100 pickup truck that we now own. It's a real beauty. Bright red and completely restored.

Another theme throughout the house that was also highlighted during the holiday is birds on a wire. There is a local artist that lives down the block from us and she paints these beautiful paintings of birds on a wire, often on fun canvas types, for example wood planks or wood trim. My wife loves these paintings and we have a number of them throughout the house. My daughters saved up money to buy her another one and they were on display after the holidays on our fireplace mantel. We even have a few throw pillows that have a similar design on them. Also, another neighbor has a tremendous talent for making cookies. These cookies have very detailed designs. She dropped off Christmas cookies for the girls and one of them happen to be a red bird, going right along with the theme of the birds on a wire.

The other things of beauty were; my wife (the most beautiful person in the world), my kids, the beautiful music in our church during the holiday, my dogs, our house, certain data visualizations and watches (which I find great beauty in). The data itself was really more qualitative, after all, it's not easy to quantify beauty. How does the saying go? Beauty is in the eye of the beholder. I decided to plot them based on the beauty that I see.


When I was thinking about how to make the card "beautiful", I thought about the techniques that I've used throughout the Dear Data Two project. The first was the braille technique I used in week 6 for Physical Contact, which I really loved. I also really liked the result of using pencils to fill color in, which I used in Week 35 for Getting Dressed. I combined this with a new technique, embossing. This was not that easy as I don't think these embossing tools were intended for postcards or the postcard paper I was using, so I was improvising a bit.

The end result was exactly what I was looking for. I wanted raised images, just like the braille technique, so that I could draw and color on them. I also wanted to incorporate birds on a wire, the flowers in the various pictures of my kids, and the color red (for the truck and the birds). Overall, this was one of my favorite cards. I loved the look and the combination of techniques. The pictures don't really do the postcard justice, but hopefully it will give you an idea of the design.

Next week: Meeting New People


Week 38 - Negative Thoughts


Jeff looked at his negative thoughts through a stained-glass window:


Notes from Jeff:


One of things that Giorgia talks about in her design work is looking around her environment for inspiration. My inspiration for this week's card actually came from stained-glass windows. There are so many wonderful churchs in the Cincinnati area, in fact, we have the largest stained-glass window in the western hemisphere, located just across the river at St. Mary's Cathedral Basilica of the Assumption in Covington, Kentucky. There are many other churches in the city that also have stunning stained-glass windows, including my own chruch, and Episcopal church. During Christmas time I spent a good bit of time there, rehearsing and performing for our Christmas service as well as the children's Christmas pageant. So this was the inspiration this week for the card's design

To create the stained-glass pattern for my card, I created a grid of diamond shapes. I used a negative sign in black and red to visualize my negative feelings and the vertical segment of a plus sign in green to show positive feelings. I separated the feeling by morning, afternoon and evening. Since the topic was negative feelings, I used a negative sign for the empty space in between the days of the week. I added a black dot to the windows for each day and time so that the windows with the data would stand out from the ones that are simply spacers. Overall, it was clear that my negative thoughts were mostly during the week. This makes sense, because as we moved closer and closer to Christmas I had a really terrific time with the family and everything was really positive.

Andy kept a very detailed log of his negative thoughts:


Notes from Andy:


Christmas...it's supposed to be the most wonderful time of the year, at least that's what the song says. Coincidentally, for week 38 (Dec 21-17), the topic was negative thoughts. Given the level of stress that I felt all week, I'm actually happy this was the topic because it helped me understand what and who was "causing" my negative thoughts.

I tracked the date, what was on my mind, the general topic, where I was, who I was with, the stress level and what I was doing.

I tend to always look at what Giorgia and Stefanie produce each week as a way of looking for inspiration. This week, I really liked how Stefanie created piles for her negative thoughts.


Stefanie included a classification of inward/outward for each negative thought then split them up so you could see how much more there was on one side vs. the other. So I went back to my data and added a similar classification. More on this in a minute.

Here are some of the highlights from the data analysis I performed on my data:

   1. My inward negative thoughts more than doubled my outward negative thoughts. This means that I was keeping my negativity to myself more than expressing it to others. For me, this is good because I have always tended to just say whatever is on my mind. Does this mean I am learning to control myself a bit more?
   2. Most of the negative thoughts were me by myself. Otherwise, Beth was second most involved. This really isn't surprising given it was Christmas week, we went shopping together, and every year I get stressed about how much we spend on Christmas.
   3. 75% of my negative thoughts were low stress...phew!!

So back to the postcard. I thought Stefanie missed an opportunity to think about the "weight" of her negative thoughts. How could I represent my data on what looked like a scale? How could I incorporate more of the metadata? I came up with this Tableau viz:


What I tried to do was make the inward negative thoughts appear "heavier" than the outward negative thoughts by adjusting the y-axis. I was also able to include who I was with (inner circle) and the topic (outer circle).

For my postcard, I was able to make it look even more like a scale and I also was able to include where I was. This turned out to be a good example of how you can do way more by hand than you can with any software.


Next week is Beauty.


Week 37 - Swearing


Andy tracked every article of clothes for the week. I gave him a hard time this week because his reprensetation of white could also be interpreted as nothing at all:


Notes from Andy:


Well wasn't this an interesting topic...SWEARING! When we moved from Georgia to California, we all noticed a lot more swearing. Then when we moved from California to London, we noticed another uptick.

It was interesting paying attention to the swearing I heard around me. I know I definitely changed my behaviour this week knowing that I was tracking myself. That's been one of the outcomes I didn't expect from this project; changing my behaviour knowing I have to report on myself. Yet this week, I still swore the most. I'm chalking this up to me being with myself all of the time.

The most fun part of this week was a Christmas party we went to on Sunday. I was covertly recording all of the swear words I heard. Naturally, as people drank more, the swearing increased. Then they caught me tracking them. And the game changed. They starting blurting out swear word after swear word, knowing I couldn't possibly keep up with the tracking. So, I ignored that noise and only recorded "natural" swears.

As for the postcard, if it didn't take so long to create, I would have re-created it. I wish I had spaced out the words better for a less cluttered effect.

I'm incredibly curious to see how Jeffrey reacts to this. He was a great sport about my drinking card, given that he doesn't drink. And I've never heard him swear. Is this project changing his opinion of me? He certainly knows way more about me than he ever did before.

Check out my analysis below to see how I interpreted what the data was telling me.


Jeff doesn't swear so he looked up an old voice mail that was left at his company and he visualized the swear words from it:


Notes from Jeff:


I don't swear, so I had to be creative this week with the data. My first thought was to track the swearing around me, which would mostly be around the office or some of my friends. Then I remembered an old voice mail. When I think of swearing this particular voice mail really jumps out. It was left on our company voice mail back in 1997, right around the holiday times. It wasn't left for me specifically, but on our general voice mail server. It was forwarded to me the very next day and has become legendary in our company. Unfortunately, I can't share the voice mail publically or I would let the world hear it. So I decided to visualize it as a sound file.

I used red to show the curse words and blue for all the other words. The bars go in both directions, which is the most common way sound is visualized in sound programs. The length of the bar represents the volume and it's mirrored in both directions to represent the two sound channels. You will notice that the message starts very calm, with only a single curse word. However, the volume quickly rises and before long the curse words are being strung together. After a barage of curse words being strung together, the caller ends the call with "Thank you. Have a nice day. And a Merry Christmas." One thing that is missing in the visualization is the thick Texas accent from the caller, which makes the entire message a bit surreal. In the end, it was clear the caller was very angry, but the combination of words, delivery and accent also makes it humorous.

As for Andy, I really loved his postcard. It quickly became one of my favorites. I loved the color and the way he visualized it. His cursing, and his friends, didn't impact my impression of him at all. Even though I choose not to curse, I am not offended by them in any way. My closest friends curse like sailors, so I've heard it all. I also enjoy listening to stand-up comedy and action movies, which are often filled with bad language. So even though Andy's card shed some light into his circle of friends, rest assured that my circle of friends are just as bad and likely worse than his. At some point I'll buy Andy a beer and we'll swap some stories!

Next week: Negative Thoughts


Week 36 - Indecision


Jeff looked at decisions when it was time to eat:


Notes from Jeff:


This week I tracked who made the decision for me on where to eat lunch and dinner. If I ate out then the decision was where to eat and for dinner at home, who made the decision on what to eat. I also tracked how many people were with me, male or female and ultimately which person made the decision. I went out to eat every day for lunch this week and had several dinners planned with friends and one business dinner. It was clear that for dinner at home, I made no choices. I don't really cook and my wife is an excellent cook, so she cooks for us at home. After 15 years of marriage I guess she's figured out what we both like, so she typically just decides for each day. This didn't really surprise me that much.

Lunch was more surprising. Tpycally when I go to lunch with people, we are often trying to decide on the way to lunch where we are going to go. So this was really an odd week due to a few lunch meetings. Monday and Saturday were especially interesting. I see when I eat by myself I have the most choices.

Andy tracked his big decisions for the week in great detail:


Notes from Andy:


For week 36 (Dec 7-13), I tracked every major indecision. I didn't want to track every little decision that went through my head, only those that really required a significant decision. I tracked a bunch of metadata for each occurrence as well:

   •Who I was with?
   •What stress level did it introduce?
   •What was the major topic?
   •How long will it take to resolve?
   •Was it resolved by the end of the week?

I'd never really thought much about my indecision before, so this proved to be quite an interesting exercise for learning more about what goes through my head. For the week, I logged a total of 19 indecisions. Of those 19:

   1. There was an even split (42%) between low and high anxiety levels. To me, that means that my decisions were either simple or hard, which doesn't surprise me as I'm a pretty much black or white kind of person.
   2. I was able to resolve 68% of my indecisions. I take that as a good sign that I follow up on things and try to not let things pester me for too long.
   3. As for who I was with, nearly half of the indecisions I logged were with my wife. That didn't strike me as unusual because it's really just a sign of a married couple making decisions together.
   4. 79% of my indecisions took days or less to ultimately resolve.

Ok, so what does all of this mean? Is there anything particular about the decisions I make with Beth?

The short answer is yes. 7 of the 9 records that include my wife I considered to be high stress decisions. But on the flip side, we were able to resolve 6 of the 9. That's a sign of a strong marriage, right? And those 3 that we didn't resolve? Well, those all had to do with money. And money is typically always the hardest thing to work out in a marriage. To me, this means we're normal.

As for the postcard, I wanted to create something similar to Giorgia's postcard for the week, with the swirls and all. And I also wanted to see if I could create the same effect in Tableau. I was able to get really close in Tableau.


Lastly, here is my entire Tableau analysis, plus my postcard. Enjoy!


Next week swearing!


Week 35 - Getting Dressed


Andy tracked every article of clothes for the week. I gave him a hard time this week because his reprensetation of white could also be interpreted as nothing at all:


Notes from Andy:


It's Christmas Day and I'm working on Dear Data Two. If this isn't proof that a project like this can take over your life, then I don't know what is.

The topic of "Getting Dressed" for week 35 felt way too similar to week 19 (Wardrobe), but I knew I couldn't take the easy way out and do the same viz again. I had two inspirations for this postcard, Jeff's bullseye card from week 19 and Stefanie's week 35 postcard which showed every article of clothing she wore. I ended up somewhere in the middle.

The data collection was straight forward. I logged every article of clothing in eight categories every time I changed. From what I wore on my feet to what I wore on my head. I then explored the data in Tableau, which you can see below.

In Tableau, I wanted to try to mimic Stefanie's card by "stacking" my clothes and I wanted to create a bullseye viz like Jeff did. I really liked how the bullseye turned out, so I showed both options to my wife. She thought the stacked clothes were easier to understand because it's like I'm building a person from toes to head.

The postcard reveals a few things:

   1. Clearly I like the colour blue.
   2. I wore trainers every day, but that's been the norm since I worked at Facebook.
   3. I never wear anything except boxers to bed. TMI, I know, but this is a project about learning about myself and my habits after all.

Not the most exciting week from a learning perspective, yet it was interesting learning my patterns.


Jeff looked at cost of his clothes each day, showing upper and lower body. My son Oscar saw this postcard and immediately said, "he has expensive clothes":


Notes from Jeff:


This week I calculated the cost of the clothes I wore each day. I used data from Amazon, American Express and a few websites to get the exact cost of each item and then totalled them up for upper body and lower body for each day. I used colored pencils again this week, this time to color the background of the postcard. Then I use the pens to plot the cost of the clothes up and down for each day.

A few learnings this week. It's much more expensive to dress for cold weather. The combination of layers, sweaters and sport jackets and costs really raised the costs quickly. My lower body was typically jeans or dress pants, boxers, soxs and shoes. Of these, shoes were the most expensive. For upper body, I typically layers two shirts and then a sport jacket or a sweater and then wore a coat on top of that. If dressing in dress pants or sport jacket then I also changed clothes aftr work, so there were additional costs for the change of clothes. As Oscar pointed out, clothes can be very expensive. It adds up very quickly.


Next week: Indecision


Week 34 - Urban Wildlife


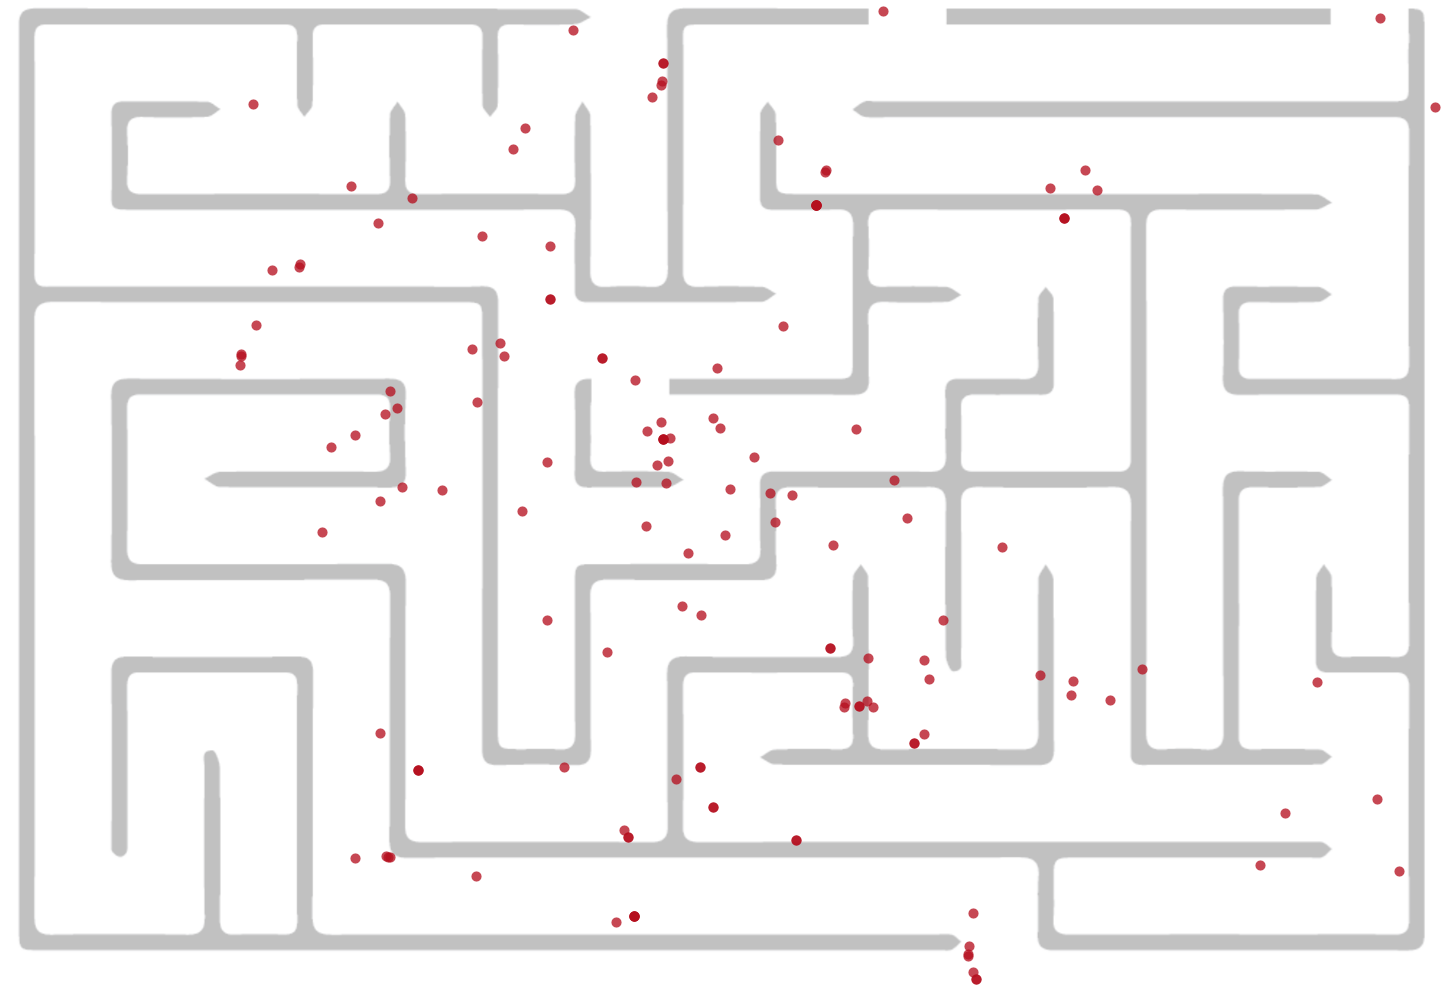
Jeff looked at complaints to the city about rats and plotted their location in a maze:


Here are the points in Tableau:


Putting the points on a maze in Tableau is fairly easy, using a background image:


Notes from Jeff:


This week I used a database from the City of Cincinnati and looked at the complaints involving rats. Most of these complaints were in certain locations downtown. This week I used Andy's method of using Tableau first. I brought the data into Tableau and plotted the locations on a map. Then I drew those locations on the postcard. Once I had the locations on the postcard, without a map, I drew a maze on top of those locations. What better way to depict rats than in a maze.


Andy looked at pigeons, mapping them with a cool overlay similar to what one of my students did, which is posted in week 21:


Notes from Andy:


As soon as I saw the topic for this week, I knew exactly what I wanted to track...the ever present London Pigeon. He/she is mean as hell and one day I'm convinced we'll all be attacked by them. I tracked them all week, but for the postcard, I focused on my daily walk between Waterloo Station and The Data School.

The pigeons scare the daylights out of me, but this week, I decided to note every time and place that I saw a pigeon and how they reacted to me. One interesting thing I found is that they only seem to be prevalent during the day; I only saw one all week in the evening.

After plotting them on a map, I decided to copy what one of Jeff's students did in class: create a map overlay. The postcard itself only plots the pigeon sighting (which I really like how it turned out), whereas if you add the map overlay, you then see the locations of the pigeon sighting. Great idea from UoC!!


Next week: Getting Dressed


Week 33 - Envy

Andy looked at the weather, comparing the weather he enjoyed in California to London:


Notes from Andy:


I'm not going to lie, I really struggled with data collection for this week. I looked all over the web for inspiration. I checked out Dear Data to see what they did. I thought about what envy means, and I totally overcomplicated everything. In the end, I set out to collect data on things I was envious of, but by the end of the week I had nothing.

I turned to Jeff and told him about my problem and he gave me a few suggestions. Things like creating a survey for myself or the kids. Then as I finally saw the sunshine again, it hit me. What I'm most envious of is the great weather that we used to have in California, and by contrast, how generally dreary the weather is here in London. Throw in the lack of daylight and I thought I was on to something.

To collect the data, I went to Weather Underground and recorded the high temperature, overall weather condition for the day, sunrise and sunset. I then started to explore the data in Tableau to find a story I could tell.

Here's to hoping I see the sun again before April!


Jeff looked at the source of envy and drew an envious eye:


Notes from Jeff:


Like Andy, I also struggled with data collection this week. Maybe envy isn't one of those things we are as aware, like our moods such as being happy or sad. When I sat down and reflected on the things that I could think of, music was the biggest one for me. I changed careers, nearly 20 years ago at this point and decided to stay in business rather than pursuing music. Having gone to music school, where I also met my wife who is a professional musician, I have many friends that are still professional musicians. I have a number of good friends in the Cincinnati Symphony as well as many other orchestras in the Cincinnati area. I often see them performing or hear something at a concert and wish that I could perform those pieces again. There are no words to describe the feeling of playing a major orchestral work, a Mahler Symphony or Carl Orff's Carmina Burana as an example. Works like fun, powerful, moving or emotional just don't fully describe the feeling. I guess I would use the word transcendent. I'm very fortunate to have the career that I have now and still be able to perform music, but I do miss it from time to time.

When I thought about the topic of envy, the first thing that came to mind was green. So I knew that I wanted to use green in some way. I decided to draw a green eye. I found some images that provided inspiration for the postcard and began to draw. I incorporated the data into the lines of the eyelashes, which plot the categories of envy along with some degree of scale. I drew the card entirely in pencil, using two green pencils and a gray and black pencil. Once I had everything complete, I went back over the ends of the eyelashes with 3 color ink gel pens to make them stand out a bit more.

Next week: Urban Wildlife


Week 32 - Sounds


Jeff measured how loud various sounds and music were in his house:


Notes from Jeff:


When I think of sounds in my house, I think of music playing, the TV, the dogs barking and the various music practicing that goes on. My wife is a professional singer and music teacher. She is adjunct faculty at the University of Cincinnati College-Conservatory of Music, teaching voice lessons. She also teaches out of our home in our music studio room, equipped with a grand piano and loads of instruments. My wife and I met in music school and I used to play trumpet professionally. With all of these sounds and music on regular basis, I decided this week that I would measure the range of sound, specifically how soft and loud are we.

Measuring how loud a sound is used a measurement called decibels. The decibel (db) is a logarithmic unit used to express the ratio of power and intensity. In acoustics, we use decibels to measure the sound pressure level, or for our purposes, how loud something is. I put some references on the postcard, so that it would be clear that, even though I am visualizing the scale linearly, the scale is logarithmic. I also listed some well known sounds to give some context as to how loud things are at my house.

   Loudest sound possible = 194db
   Shotgun = 160db
   Jet engine = 120-140db
   Sandblaster = 115db
   Top end of Jeff playing his C trumpet = 114db
   Power saw or chain saw = 110 db
   Top end of Mary singing = 108db
   Three dogs barking at the doorbell = 100db
   Jackhammer = 95db-130db
   Subway or passing motorcycle = 90-95db
   Normal conversation = 60db
   Whisper or a quiet library = 30db
   Weakest sound possible = 0db

To take these measurement I used a sound meter that measures in decibels. Looking at the list above and comparing it to my house, you will see that the loudest ranges of Mary singing and my trumpet playing are well over 100 decibels and reaching 110 db or more. Hard to believe that Mary can sing as loud as a jackhammer and I can play my C trumpet louder than a chainsaw and as loud as a sandblaster. Keep in mind though, this was the top volume measured, not the normal volume of playing. Still, I have to wonder what the neighbors think about all of this!

For the postcard, I took my inspiration from a soundboard, which has various levers that you move up and down to turn the various channels louder and softer. I made a mistake on Mary's range, but I decided not to go back and correct after making two drafts of the cards already.

Andy measured a number of things this week, looking at the length in minutes, the location, categories and the activities he was doing:


Notes from Andy:


This week I wanted to keep data collection simple, as I had to travel to Northampton to run a 2-day Tableau training class. I tracked everything I listened to, where I was, what I was doing at the time and how long I listened.

I tend to have a fairly set routine, so I didn't learn much about myself this week. Overall, I listen to podcasts on the train and when running and I listen to music at work and when running. I was hoping that adding the length of time listened would provide some insight, but it really didn't. The longest things I listened to were sporting events and movies, duh, of course!

Anyway, here's my Tableau story that walks you through how I looked at the data. For the postcard, I drew inspiration from Giorgia's postcard, which looks like a sheet of music. I have my lines going down as well, but my didn't turn out quite as nice. It looks like I'm hanging myself when running.


Next week: Envy


Week 31 - Positive Feelings


Andy tracked his positive feelings throughout the week in great detail:


Notes from Andy:


I recently had a conversation with Paul Banoub and he was telling me about the impact that the Dear Data Two presentation in Vegas had on him, particularly when I talked about being nicer to people (specifically my family). This really struck me and it made me realise that I have a great opportunity through this project to really learn about myself.

So when I looked back at tracking positive feelings, I assumed that all would be rosy and great. I mean, I have a great life, a great job, a great family, live in an amazing place. Yet little did I know that I was in for a shock!

For week 31, I tracked the time, place, who I was with, and what I was doing each time I felt a positive emotion. I started by exploring the data in Tableau, which I walk you through in the story points below. The shock came when I started looking at the people I was having positive feelings with, or I should say, the people I WASN’T having positive feelings with, notably my three youngest kids. I had no idea that I felt this way until I actually looked at the data, and this is the power that this little project has brought into my life. It has helped me recognize areas where I can improve. For that, I’ll be forever grateful.

If I listen to the data, I can make a real, significant difference on my life, how I perceive people, how I treat people, and how and who I spend my time with.


Jeff looked at positive and negative feelings through the news:


Notes from Jeff:


I often hear people say, my wife being one of them, "I don't listen to the news, because it's always bad news and never any good news." I decided to analyze the news stories through the week to see if I could find any "positive news". This exercise sort of proved that what those people think, it's true, most of the news articles do seem to have a negative sentiment. However, there were a glimmer of hope. Wednesday just edged out as positive for the day and Tuesday was also really close. This might be something to explore in the future over a longer period of time. Are certain days of the week or certain months more negative in the news vs. other times?

To gather the data, used CBS news articles for each day. I grabbed the text of the articles for the day and put together some R code to measure the positive and negative sentiment of each day's articles. Each day has a positive score and a negative score and then an overall score, showing the day as either positive or negative. For the postcard, I used a flower petal with three stems for positive and three stems for negative. The dots represent the score for positive (blue) and negative (red) and the overall sentiment score is listed, above or below the center line of the flow petal.

Creating this in Tableau is interesting. I immediately thought of using the method that Brian Prestige from the Information Lab posted here, but instead, I decided to try something different. I wanted to try to recreate using some math formulas to generate the flower shapes. This worked out pretty well, although not entirely the same as the original, it's very similar in design and uses 360 points and only two short math formulas for the x and y coordinates.


If you would like to recreate in Tableau, start with 360 points, 1 to 360 numbered in a column in Tableau, [T] = 1 to 360

  X = (1+cos(8*[T]))*cos([T])
  Y = (1+cos(8*[T]))*sin([T])

Then simply plot X and Y on the Columns and Rows and adjust the shape, size and color as you wish. Also, try to play with the number 8 in the formulas above for other fun shapes!


Next week: Sounds


Week 30 - Time Alone


Jeff created an hourly calendar visualizing the time he was alone (not very much) each day:


Notes from Jeff:


Last week the topic was "wives" and I was at the Tableau conference. This week the topic is time alone and my wife was out of town for the week for some music performances (she's a professional singer and was doing a concert and masterclass series out of town). So this week was a very unusual week for me. In addition to work and teachings, I was also with my girls for lots of time during the week, taking them and picking them up from school, etc.

I wasn't truly "alone" for much of any time. The only time was in the car on my way to and from work to get the girls. I decided to count the time when they were asleep as alone, so the card is more "the feeling of alone time". Even with that, there wasn't much time alone. A few hours at night, then sleeping and short windows of drive time. This was really surprising to me.

For the postcard, I decided to try something new. I used colored pencils instead of the gel ink pens that I typically use. This created a very different effect for the card from any previous week. I really like this effect and plan to use this again in future cards, maybe experimenting with the pencils and gel ink together.

The tricky part in Tableau is the half-hour segments, otherwise this would be pretty straight forward with using hours by day for each day. In this case, I divided the data up into 30 minute segments so that I could code the half hour segments on those days. This worked great for the color, but then I needed lines in one hour increments by day. To deal with this, I simply set the tick marks approriately and then used gridlines with the right color, transparency and width to get the effect I wanted. Tableau's colorpick tool came in handy to snag the colors right from the image of the postcard.


Andy created a card that was packed with detailed information using five different pre-attentive attributes. He used position, length, shape, size and color to encode six different elements of the data:


Notes from Andy:


Going back a few weeks to catch up on some postcards I’m behind on. For week 30, we had to visualise our time alone. At the start of this week, we were on a family holiday in Copenhagen (which you can read about here).

This was the first time I ever remember consciously thinking about my state of “being alone” and what being alone means. I always thought that I was alone more than I apparently am. In this week, I was alone 44% of the time, and what really surprised me is that I was alone the most on a Saturday, which is when I normally spend a lot of time with the kids. Perhaps this isn’t a representative week of my life due to our family holiday. If you don’t count sleeping as time alone, then I spent very, very little time alone in this week. I really do enjoy being around people though.

As for the data collection, I created a spreadsheet for each hour of each day and recorded whether I was alone or not. I defined “alone” as being either:

   1. By myself
   2. Around others but not interacting with them
   3. In an “alone” state of mind

From there, I recorded what I was doing during each hour. I then looked at Stefanie’s postcard because I wanted to emulate what she did in Tableau before creating my own postcard.


Next week: Positive Feelings


Week 29 - Wives


Andy created and visualized his wife KPI, which is Beth's opinion of Andy over time:


Notes from Andy:


Week 29 had me all over the place. The topic of “my wife” was so broad that I had a bad case of analysis paralysis. Should I track her movements? Should I ask her to track something? Should I analyze all of the wonderful pictures she’s taken? Should I do a word analysis of her blog?

I then had a chat with my boss, Tom Brown, and in his Tom Brown way, he said that I should simply track the number of wives I’ve had over time. Well, I went with that idea and added a twist. At our #DATA15 presentation, I talked about the wife KPI, so what I decided to do is create a chart of the wife KPI since Beth and I first met in 1992.

From there I added major milestones to the dataset, categorised those event as positive or negative, then built a simple line chart. It's really interesting to me to see the ebbs and flows of our relationship. I would have never noticed it if I didn't see it depicted on a graph this way.

Note that on this postcard, I intentionally used red/green to indicate bad/good. I preach to people not to do this if they don’t know if their audience is colour-blind. In this case, my audience of 2 (Jeff and my wife) are not colour-blind, so I knew it would work.


Jeff tracked the driving pattern of his wife:


Notes from Jeff:


The topic for the week was "wives", but this happened to be the week that I was at the Tableau conference in Las Vegas. It was a very busy week and I was on a different time zone from home, so I actually didn't speak to my wife all that much during the week. When I got back from the conference and thought about what I could track, I decided to plot her driving pattern. I was able to piece together all of the trips, from home to school, dropping off the girls, then back home, then teaching at the University of Cincinnati and various other trips, like going to our church or the grocery store.

To plot the data this week, I used Andy's weekly approach to the data. I first gathered the data, located the addresses for each stop, geocoded them, and then immediately imported it into Tableau and started mapping it. Once I had the patterns mapped in Tableau by day then I sketched out the card. I didn't realize until after sketching the card a few times that there was some sort of geocoding error. One of the addresses was geocoding correctly. So I had to go back, find the error and correct it and then create the card over again.


I decided to use a black post card this week, something I did once before in 22 - Our Past. I really liked the way the colors popped out on the dark post card. In Tableau, I started with a map of all the trips.


Then I filtered and colored by day and then removed the map layer to assemble them for the postcard design.


Next week: Time Alone


Week 28 - Smiling at Strangers


Jeff created a smiley-shaped card:


Notes from Jeff:


Andy correctly noted that I am more of an introvert than he is. This is an understatement. We're basically on two ends of the spectrum. He is very much an extrovert and I am an introvert. Smiling at strangers is not something I would typically pay attention to. He would likely engage and talk to them, while I would more likely keep to myself. Regardless, I tried to pay attention to this throughout the week. The biggest problem was that most of my time was spent at home or work. This might have been a good topic for the week in Vegas at the Tableau conference, but in a typical week this isn't something that would yield much data.

So for the card, I decided to create a shape that visualized the shape of a smile. I used half-circles to create that effect. I chose red, orange and pink instead of blues, greens and other colors to keep the color closer to lip colors. Without much data, this week turned out qualitative, more of a representation, and not quantitative.


Andy created a card that was packed with detailed information using five different pre-attentive attributes. He used position, length, shape, size and color to encode six different elements of the data:


Notes from Andy:


I was really looking forward to this week! Anyone that knows me knows that I LOVE talking to strangers. My wife has quite a few good stories to tell about me making the odd conversation with someone I don’t know. Mostly what I enjoy is seeing people’s reactions. I find most people to be accepting, but there are times when I probably should keep my mouth shut.

For Dear Data Two, I had to track smiling at strangers only. Meaning COMPLETE strangers. I collected data based on the date, location, and how the person reacted.

Locations were then grouped into five situations:

   1. Traveling
   2. Coffee & Food
   3. Leisure Activities
   4. Shopping
   5. Work

I strictly recorded only one reaction/interaction per person:

   •Smiled back
   •Smiled at me first
   •Didn’t notice me
   •Looked away
   •Pretended they didn’t notice me

The reactions were grouped by sentiment:

   •Positive = Smiled back & Smiled at me first
   •Neutral = Didn’t notice me
   •Negative = Looked away & Pretended they didn’t notice me

I did a lot of exploration of the data in Tableau, which you can see by clicking on the image below. The most notable finding was how friendly people were while traveling. This surprised me because I assumed travel correlates with stress; I’m glad to know I’m wrong.

Overall, a super enjoyable week for me. I’m interested to see Jeffrey’s take on this topic. I think he’s a bit more introverted than me.


Next week: Wives


Week 27 - Media


Andy tracked the device, the source and the volumn of news stories for the week:


Notes from Andy:


Data collection for week 27 was simpler than most, and I’m quite thankful for that since I forgot to track the data as I prepared for talks in Cincinnati and Vegas. I looked retroactively at my history on the apps & websites on which I consume stories and articles. I only counted articles that I actually read and not just skimmed over. I did not count the content on Facebook that you see, but don’t click on.

From there, I did some quick analysis in Tableau to understand the data before creating the postcard.

When I went into the project for this week, I fully expected Facebook to dominate other consumption methods. Yet to my great surprise, Feedly was far and away my preferred method for consuming stories. I’m not exactly sure why this is, surely it has something to do with the design of their product. In Feedly, I choose the content I want to follow, so it’s much more likely to be of interest to me. Whereas Facebook tends to be a lot of noise and little signal as far as stories and articles are concerned. I don’t look at my LinkedIn and Twitter timelines often, so it’s no surprise that those as so low.

The inspiration for the postcard came from Giorgia’s week 13 postcard about her desires. I wanted to use stars like she did, but I couldn’t find a stencil to use. I went with hexagons instead.


Jeff looked at the sources of where he gets his news on a daily basis:


Notes from Jeff:


I decided to keep it simple this week, simply looking at where the sources of my news come from. I found that most of my news came from public radio. The routine is pretty set, listening in the morning on the way to work, but only sometimes on the way home. On the trip home I often made phone calls or listened to something else on the radio besides news and if I did listen it was mostly for a quick stock market update. During the day, I found the primary source of news was Twitter and other Internet sources. Prior to Jon Stewart retiring, I watched the Daily Show fairly often, but not regularly. I was surprised to see how many of the stories I had not seen, although they were often not major news stories. Lastly, I found that my friends and wife pushed news stories to me. An email from a friend that might read, "did you see this?" or my wife mentioning something that happened in passing. However, my wife doesn't watch the news much, so it's mostly local stories that she mentions. All in all, I realized I don't really seek the news. It seems to be pushed to be from a variety of sources.


Next week: Smiling at Strangers


Week 26 - Workspaces


Jeff created a postcard showing all of the color variation of his pens on his desk for the Dear Data Two project:


Notes from Jeff:


The dear data project has turned my home office desk into a crafts table. Here's an image I snapped many weeks ago, showing what my work area at home looks like.


For this week's card I decided to show the color and style of every ink pen that I have. I have purchased a half dozen gel ink pen sets for this project. I have used pens from all of these sets at various points in the project, but I find myself mostly using pens from two sets. One set that I use often is a set of MUJI gel ink pens, which Giorgia Lupi mentioned during the Dear Data project, so I thought I would give them a try. My other go-to set is Staedtler. I find that the MUJI set gives me great precision while the Staedtler set gives me a good range of color and a medium pen tip. For the card, I went set by set and tried to show the color and tip stlye of each pen. Some of the pens work well in UV light as well, which is the light I used back in Week 13 with invisible ink.

Andy created a really cool Tableau viz of the workspace at the Data School, where each person sits, and then created his postcard. I especially liked his design choices, a very specific font and the covert data gathering on how many donuts each person usually eats:


Notes from Andy:


After a hiatus to get ready for our talk at #DATA15, I’m now several weeks behind and playing a game of catchup again.

The topic for week 26 was workspace and my first thought turned to the Data School and the consultants I get to train every day. To say some of them are creatures of habit would be a massive understatement. Just a week into their training, they were sitting in the same spots every day, so I made them start rotating places. Some took well to this and others (ahem Damiana) insisted on maintaining their spot, even occassionally threatening the coach.

They also have a great affection for donuts. Most Fridays I bring them a sugar filled breakfast. Little do they know that I’ve been tracking their seating and donut eating habits during their time with me. Naturally, since this week is about them, I decided to create donut charts with their pictures in the middle to show how often they sit in their favorite spot.

This was a fun process that I’ll detail in another blog post next week as a Tableau Tip.

Creating the postcard turned out to be an absolute pain! First, I had the table backwards, so I ripped that card up. Second try, the colours I chose for the donuts didn’t work, so I ripped up that card. Finally, I got the card completed, pasted on their little pictures, only to realize I had the table backwards again. I decided to heck with it; good enough is good enough and this project is about learning from the mistakes we make along the way anyway.

Lastly, I added little chocolate donuts under each picture to show how many they typically eat.


Next week: Media


Week 25 - Friends


Andy looked at where his college friends live now, using paths to show the distance from college:


Notes from Andy:


I’m starting to fall a bit behind on the postcards again, but I have a good excuse. I’ve been preparing for four upcoming talks - two in Cincinnati this coming week and two at the Tableau Conference in Vegas. Excuses behind me, I went for a simple data collection method for learning about my friends.

I had a good idea in mind for what I wanted to do and I started by looking at all of my Facebook friends, the idea being that I wanted to create a map of where they all live. Unfortunately Facebook does not make it easy to get this information. The data preparation was going to take way too long, so I opted for looking at where my college friends Facebook live.

I entered all of their names and current locations in a spreadsheet and then added a second row for each person that was the location of our college, the awesome Eckerd College in St. Petersburg, Florida. Don’t look at pictures of my college; you’ll get way too jealous.

I then took all of the locations and ran them through batch geocoder to generate lat/long values for each person. This allowed me to calculate the distance each friend has moved away since college. Duplicating the rows also allowed me to create lines connecting Eckerd College to each person.

For the postcard, there’s no way I could have drawn a dot for every person, so I aggregated some locations together and used size to represent each person or group of people. I intended to use shapes as well, as you can see on the front of the postcard, but I forgot once I got into drawing the card. Chalk another victory up for the design medium.


Jeff created a friends tree showing his closest friends and his Facebook friends:


Notes from Jeff:


This week I was thinking about how to disply my friends and a family tree came to mind. I though about creating a network diagram of some sort, but then came back to the tree idea. I showed my closest friends as larger circles, sizing them by how long I have known them. I colored the circles based on male and female and connected smaller circles to show how many children they have. I filled in the rest of the tree with dots, which represent the number of friends I have on Facebook. I mostly use LinkedIn for business contacts and Facebook for my friends, so this is a pretty good measure of my friends vs. casual business relationships. In the end it was interesting to see that I have a few really close friends that I have known for many years.


Next week: Workspaces


Week 24 - Doors


Jeff created a postcard showing the direction of every door in his house:


Notes from Jeff:


For this week's card, I plotted the direction and color of every door in my house. Most of the doors are either wood or painted white. I have a number of pocket doors, which slide open and close and I have a number of doors that are in conflict with each other. These doors can't be opened at the same time and they would hit into each other. I plotted the conflict doors on top of each other to show how they would collide.


Andy created a beautiful and colorful postcard of the color of the doors in his neighborhood:


Notes from Andy:


When I saw the topic for week 24, I immediately knew what I wanted to create. In California, our neighborhood was managed by a homeowner’s association, which meant uniformity everywhere, including every house door being black. One of the first things I noticed upon moving to our home in Kingston was how colourful the doors are.

Since there are so many homes on each street (townhouse/terrace style homes mostly), it was going to take quite some time to document all of the door colours. My wonderful daughter walked me with to help with the survey; I wrote down the door colours while she told me what they were. We got a few bizarre looks from people. Given that I was writing in a notebook as we looked at each house, it wasn’t too surprising.

When I started entering the data into Excel, I realized that I didn’t write down the house numbers. So out we went again for a second survey. After entering all of the data, I copied the addresses into Batch Geocoder to get the latitude and longitude for each address.

Next, I create a custom black and white Mapbox map for use in Tableau. I initially used a house shape for each house, but when I was showing this to people at the Data School, they thought it looked to cluttered, so I stuck with circles.

My postcard looks pretty similar to Tableau in terms of style. However, I think my postcard looks cleaner and simpler. I almost felt like an architect or city planner creating this map.

Enjoy!


Next week: Friends


Week 23 - Being Nice


Andy created an antenna chart showing the ways he could be nice to people closest to him:


Notes from Andy:


I had finally caught up on all of the Dear Data Two postcards, then this extremely difficult topic came up. The problem isn’t necessarily the topic itself, but the data collection. How the heck do you collect data about being nice?

My initial thought was to do a word analysis for Tweets and emails, but that didn’t interest me much. I considered tracking every time I said something nice to someone, but that would be a data collection nightmare.

Instead, I settled on a simple list of some of the people I’m closest to and ways that I can be nicer to them. I borrowed heavily from Giorgia’s categorisation. From there I thought I would create tree-like structures for each person, but when I sent a sample to Jeffrey, his first comment was:

     Wow. This looks really awesome. Antenna charts.

So deflated! But drawing the trees meant adding a lot of rows to the dataset. Maybe this was a blessing in disguise. I decided to go with the antenna charts idea and straightened out the branches. The Tableau part was pretty simple, since it’s really just a game of “connect the dots”. The tough part was transforming this onto a postcard given my limited drawing skills.


Jeff created a puzzle card with the attributes of being nice according to his kids:


Notes from Jeff:


Just like Andy, I found this week's topic very difficult. I was puzzled about this topic and that gave me the idea to actually create a puzzle. So I asked my girls what they considered as "being nice" and put those pieces together into a puzzle. The card is built so that the dotted lines could be cut and then the pieces would be a puzzle to put back together.

I also recreated this postcard in Tableau, not just as a static viz, but also as a working puzzle game using Tableau parameters. I have a blog post that goes into more details about this here.


Here's the Tableau version of the postcard:


Click the image below to open then viz:


Next week: Doors


Week 22 - Our Past


Jeff visualized his past using code written in BASIC.


Jeff's postcard:


Notes from Jeff:


For this week's card I decided to write code in the first computer programming language that I learned as a kid, BASIC. I started programming on a Commodore Vic 20 computer and shortly after moved to my childhood favorite, the Commodore 64. The code produces a year by year description and visual from age 4 to 24. The Commodore screen was actually blue (similar to the color below), but I only had a few choices of postcard colors, so I decided to try a black postcard and used green to show the code. I really liked the effect. I have to admit that Paul Banoub beat me in a game of pool at the Tableau conference, but I request a rematch on a pool table that doesn't drift all the pool balls to one side.

You can try this code yourself and see the output using this BASIC emulator here.


Creating in Tableau was simply a text box with the code, but the key was finding the right font and getting the window to size just right. I found a Commodore 64 font, so I decide to use that for the Tableau viz in honor of my roots.


Andy looked back through his career with a variation on a visual resume.


Notes from Andy:


The topic for week 22 of Dear Data Two was our past. I immediately knew what I wanted to create in Tableau, and that was a visual resume (which you can view here). The inspiration for the resume comes from Ben Jones, who showed me his resume built in Tableau a couple years ago before he started working at Tableau.

From there, I started working on a couple of different draft versions of my postcard for Jeffrey. I thought I had settled on one and I showed it to my wife. When I asked for her impressions, she thought it was strange how I had stuff going left and right; she thought left looked negative and right positive, so in the final version I incorporated her feedback.

Data collection was pretty straight forward. I used:
  • LinkedIn for the dates of my professional history
  • Blogger for the dates when I started my various blogs
  • The rest was by memory (or what is left of it)

From there, I simply plugged all of the dates into Tableau, categorized them, and built the resume in Tableau.


Next week: Being Nice


Week 21 - Our Cities


Andy created a really cool itinerary for a 5-day vacation in London. I was just in London last summer teaching data visualization for KPMG, so I was fortunate to see a few of these things, but I look forward to returning someday and going through his list. He really nailed it. One thing on my bucket list is to see the brass band competitions at Royal Albert Hall and I was only able to see St. Paul's Cathedral from the outside, so I would love to see the inside someday. The only reference that might be off is that he said I "like to read", but I really only read technical stuff, mostly data visualization and data mining related and frequently on-line. Regardless, I really enjoyed my time in London and this postcard really looks like a great list to explore if I return.


Notes from Andy:


The topic for week 21 was "Our Cities" and given how Jeffrey loves music, data viz and is a church-goer (amongst other things), I thought I would plan his itinerary for a 5-day holiday in London.


Jeff showed the elevation of Cincinnati:


Notes from Jeff:


Cincinnati is known as the City of Seven Hills. There's actually more than seven hills in the city and some disagreement as to what are the hills. There is a great article on the history of the seven hills here. I wanted to show the elevation of Cincinnati, using the colors to show that elevation. I was originally going to use a sequential color scheme, but I wanted to show the river, the low elevation around the river and the high elevation of the hills. I found a few elevation maps and came across one that used this color scheme. I thought it worked well for the various comparisons, even though it's a categorical color scheme vs. a sequential color scheme.


One of Jeff's students in the Fall semester of the data visualization class at the University of Cincinnati created a really interesting card for this week. He visualized a scavenger hunt that he did in Cincinnati and showed the top 3 teams. The postcard had a base map of Cincinnati and then included 4 transparent cards to overlay on top of the map that were inside the postcard, which was contructed with a pocket to store them. There was a map key overlay as well as 3 teams. The result worked really well. Each overlay showed the different results for each team.


Next up: Our Past


Week 20 - Interesting Things


The Data School Students


This week was a really interesting week, not just because of the topic, but also because of the involvement of the students at the Data School in the UK. Andy had the students participate in the Dear-Data-Two project using his own variation of the well-known "visualize two numbers" exercise. He asked the students to visualize two numbers, his Instagram Likes (233) and his Twitter Favorites (65). Then they created postcards based on this exercise, visualizing those two numbers as well as the detail behind them. So before we look at our cards, here are some images of the cards from the students at the Data School.

The Data School students hard at work:


and their postcards:


Alex's postcard:


Emily's postcard:


Nicco's postcard in 3D prior to mailing (it didn't survive the mail very well):


Pablo's postcard:


Ravi's postcard:


Sasha's postcard:


Jeff received these six postcards from the Data School students, so he decided to create a card in response. His card shows the preattentive attributes and the use of color in data visualization.


Notes from Jeff:


I was really impressed by the work by the students at the Data School. I wanted to send something back to them as part of this week's topic. Since they are students of data visualization (part of their program), I thought hard about what was interesting and related to that topic. I decided to do a card that represents the use of preattentive attributes and the use of color in data visualization.

For those who might not be familiar, I've represented: Orientation, Length, Width, Size, Shape, Curvature, Marks, Enclosure, Intensity (color Value), Hue (color), Position and Spatial Grouping. For color, I showed the three ways that color should be used, sequential, diverging and categorical.


Andy used the same data set that he gave his students:


Notes from Andy:


The topic for week 20 of Dear-Data-Two was "interesting things". I started the week by recording every little thing that I found interesting, but that quickly became overwhelming to keep up with. Instead, I decided to compare Instagram likes to Twitter shares. My thinking is that if I like something on Instagram or share a piece of content on Twitter, then it was interesting to me.

This resulted in the ultimate small data, which I tasked the Data School with visualising as well. The premise of the activity is to give yourself 60 minutes to create as many different visualisations in Tableau as possible. I came up with 70, and I walk you through them in the story below.

Here is his Tableau Public Visualization:


Next week: Our Cities


Week 19 - Beauty Products


Andy tracked his beauty products for the week.


Notes from Andy:


This week wasn’t the most interesting ever. I suppose for the Dear Data ladies it’s probably a bit different. For me, I tracked the “beauty” products I used throughout the week. From there, I explored the data in Tableau, which helped me uncover an interesting insight. I have detailed the insight in the story below.


Jeff showed the various locations on his body that he used beauty products, mostly his hair.


Jeff's postcard:


Notes from Jeff:


I really don't use a ton of beauty products and I'm not even sure the things I use daily are considered beauty products. Basically shampoo, shaving gel, deodorant, a little hair gel and hair spray, and some cologne. It's exactly the same amount everyday, so instead of measuring them, I decided to draw the locations on my body. I used some simple shapes to outline my body and with different shapes and colors showed the different products and their location.


Next up: Interesting Things


Week 18 - Drinks


This week our children got involved in the postcards. Andy's son Oscar sent Jeff a card and so Jeff's twin girls decided to respond with a card as well. Elle created a card on her own, showing the amount of liquids each of her bottle holds. She drew the card herself, including a batman logo on her batman water bottle.


Elle's postcard:


Nina looked at the musical notes that were created by filling glasses with water to different levels, but she was less interested in making a postcard, so she described her idea to Dad and he did her postcard for her.


Nina and Jeff's postcard:


Notes from Jeff:


It was great to work with the girls this week, although it wasn't all fun and games. Nina was far more interested in playing with the activities, like a science experiment, rather than actually sitting down and creating a postcard. Elle sat down and took the postcard very seriously. When she was done she said, "this really take a lot of time". I think she had a new appreciation for all of the work it took to create the weekly postcards.

When Nina started she wanted to play with colors. She loves colors and she wanted to see if sprinkles would melt in water and create different colors. When that didn't work out, she (and mom) decided to make musical instruments out of those glasses and measure the amount of water in each glass. They filled up glasses to various heights and recorded the notes that were played. She was far more interested in playing with the glasses and making the sounds then actually working on the postcards. So when frustrations were starting to show, I decided it would be best if I just helped Nina create the postcard she had pictured in her head. Nina described to me what she wanted for her card and then I created the card. We called the end result "Water Music".


Andy and Oscar did postcards showing their drinking throughout the week. Oscar's card was the impetus for Jeff's daughters getting involved and creating their cards.


Oscar started immediately sketching out pie charts. I think he did this on purpose, since he probably knows how dad feels about pie charts. Then he created several other sketches with lines and bars.


Oscar's final postcard.


Andy did the same, and apparently had a good time on Friday night with some friends.


Notes from Andy:


I’m actually on time with this week’s postcard. This meant skipping a few weeks, but I’ll catch up on those. Week 18 was particularly fun for me for several reasons:

My 13-yr old son did the project along with Jeffrey and me. He’s working on a blog post for his creation.

   1. It was fun seeing what I drank (and what I shouldn’t have).
   2. I learned more about custom shapes and table calculations (the learning never, ever stops).
   3. I really like how the postcard turned out; it’s probably my favorite so far.

The data collection was really simple this week. I logged all of my drinks in a Google Sheet: date/time, drink type, and the amount. I’m still having issues with the Web Data Connector for Sheets, so I ended up needing to download the data to Excel and connecting it to Tableau.

I had to rip up two postcards because I messed up. I was trying to use coins for the circles, but it’s quite a pain to fill them in. I really need to buy a stencil kit, but the stationery stores here in London don’t carry them. Instead, my wife suggested using her circular paper cutters from her scrapbooking supplies. I cut holes in the birthday card my sister sent me (sorry sis) and used those for the patterns. This really sped up the process.

My wife also suggested using light pencil lines to sketch a grid on the postcard. This was immensely helpful as well because I had to make sure all of the circles would fit on the postcard and stay neatly aligned. I then used her white eraser to remove the lines at the end.

Lastly, I want to improve my handwriting by way of this project. I’ve always really liked the handwriting of architects. A quick Google (or is it Alphabet) search, turned up this YouTube video that gave me some good ideas and I feel like I’ve made giant strides already.

With all of this in mind, here is the week 18 visualisation. Note: my Friday night was NOT a typical Friday night. I’m fairly certain Jeffrey will be ashamed of me.

Here's Andy's Storypoint viz:


Next up, Beauty Products.


Week 17 - Food Preferences


Andy looked at his food preferences during vacation.


His Tableau Storypoints Visualization:


Notes from Andy:


I'm heading back to week 17 to catch up on one of the postcards I hadn't yet created. Week 17 was about food preferences. I tracked the food I ate while on holiday in Scotland and counted the calories I consumed. The data is pretty basic, so I decide to try to draw some shapes, which is something I'm not particularly good at and something that I've been wanting to improve through this project.


Jeff ate at a restaurant in Cincinnati called Nada and showed his preferences using their menu.


Jeff's postcard:


Notes from Jeff:


This week I had a business dinner at a well-known restaurant in downtown Cincinnati called Nada. It's description is "Modern Mexican Food with Electric Design". The decor is really amazing. Check out their website here. The menu has lots of really spicy things listed. I am not a fan of really spicy food and I'm generally not a fan of onions. I decided to code things in green which I thought sounded good at the time and red for spicy foods or things I disliked. The black text is neutral, at least for this particular night.

I realize that using red and green together is not ideal for colorblind folks. I decided to use these colors anyway because green was the prominent color used on the dinner menu and the use of red made sense for spicy foods like the various hot peppers.

Here is a sample of their menu.


Creating this in Tableau is just a text box with some formatting. The only difficulty is that Tableau doesn't have an option for full justification in the text boxes, only left, right and center. By adding some spaces in various places I came pretty close.


Next up: Drinks


Week 16 - Wardrobe


Jeff used circles to show the color of his clothes from Jacket and shirt down to his shoes.


Jeff's postcard:


Notes from Jeff:


My goal this week was to show layers of colors, in the same way that clothing is layered. I used the inner dot to represent the color of my shoes and then layered circles around it as I worked up to my jacket color. I did not wear a jacket on Monday or over the weekend in this particular week.

Creating this week's card in Tableau required a bit of a trick. There is no measure in this data. I simply created categories of clothes layers, with a "blank" layer in between. Then I assigned each category to the necessary color and the "blank" layer as white.


Andy looked at his robe, with a very creative Tableau viz.


His Tableau Storypoints Visualization:


Notes from Andy:


For week 16, I tracked the clothing I wore, used shapes in Tableau to build images of myself, then drew a postcard to match.

Next up: Food Preferences


Week 15 - Compliments


In his 500th blog post (big congrats!), Andy examined his social media likes and shares.


His Tableau Storypoints Visualization:


Notes from Andy:


Just realized this is my 500th post on this blog. Feels like quite a milestone for some reason. Anyway, for Dear Data Two | Week 15: Compliments, like Jeffrey, I looked at my content that people liked across social media platforms (assuming that I can take those like, favorites, reshares as compliments).


Jeff also looked at his social media platform, favorites, tweets, retweets and new followers.


Jeff's postcard:


Notes from Jeff:


This week I examined data from Twitter. I recorded how many times my Tweets were favorited or re-tweeted and how many times I was mentioned in a tweet and new followers. I graphed this on the postcard by day of week and by these four categories.

Next up: Wardrobe


Week 14 - Schedules


Jeff created a postcard showing the things his family wanted to do on the last day of vacation.


Jeff's postcard:


Notes from Jeff:


This week happened to be schedules and we were on vacation at a cabin in Wisconsin, one of the few times of the year when we aren't paying attention to schedules. So on the last day of vacation, while my wife was out on a bike ride with her dad, the girls and I started planning what we wanted to do on the last day. Both daughters listed what they wanted to do on the last day. Now we had done many of these things already on vacation, so this was about picking their favorite things that they wanted to do on the last day before we went home.

So Elle and Nina took to making a list, which would have been helpful in week 10. After they made their lists, they went through and prioritized each thing. We then began the process of putting this all together. A few things like going to get "Ice Cream" were a given, everyone wanted to do that. Once we had the final list, I told the girls that "Momma needed to sign off on this", which they took very seriously and literally and they made me add a signature line for her to sign.

Elle's list:


Nina's list:


Combining the lists:


For the postcard, I wanted to show each of these things without writing them out, so I created squares similar to the periodic table. Short abbreviations for the things we were going to do and a number in the corner for their priority. I ordered each of them and then connected it to the final order we planned for the day. I used blue for Elle and pink for Nina (their choice of color) and green for the actual events of the day. We were able to fit most everything into one day, except for one thing each (although Nina was able to swim for a short bit when we were out boating). Looking back at the postcard now brings back the memories of our last day of vacation. It was a super fun day.

It's been a few weeks since I recreated one of the postcards in Tableau. This particular card was tricky. I really wanted the color borders of the squares. This would require coloring the borders with a dimension, which is something Tableau doesn't offer. So I used a dual axis to put one square on top of another. One square is the color I want based on the dimension and the other square, that is slightly smaller, is white with the text. The white square covers most of the colored square leaving just a border. The dotted lines were achieved using annotations. This gave me the ability to place them exactly where I wanted them and to style and color the line.Overall I was really pleased with the way it turned out. Pretty close to the original.

Tableau Version:


Andy examined his productivity from Moves, Fitbit and Sunrise.


Notes from Andy:


Nearly caught up on the weeks I had to skip. Week 14 was pretty straight forward, but I wanted my gantt chart to look a bit fancier so I put dots on the ends. For this type of lollipop Gantt chart, you need to use both axes. I'll show how to do this for Tableau Tip Tuesday next week.

To collect the data for this week, I combined data from Moves (for places and times), Fitbit (for sleeping) and Sunrise (for my calendar). I entered everything manually into Excel and connected it to Tableau.

His Tableau Storypoints Visualization:


Next up is Compliments.


Week 13 - Desires


Andy examined his desires and dislikes.


Notes from Andy:


Only a couple more weeks to catch up on. Today I got back to week 13, when I tracked desires and dislikes. To track desires, I logged every time I thought about things like: desires, wishes, cravings, requests, asking for, urges, etc. For dislikes, I logged things like: dislikes, loathes, disgusts, aversions, hates, etc.

In Tableau, a unit chart seemed to make the most sense for visualising the frequency. I then thought about the Facebook "Like" icon and decided to switch to using that symbol as the unit chart. A simple square communicates much more effectively and it much easier to count quickly.

Flip through the Tableau story below:


Jeff created a top secret postcard, using invisible ink.


Jeff's postcard:


The postcard appears blank:


The postcard in UV light:


The postcard in UV light:


Notes from Jeff:


I had this idea and actually created this card earlier on in the project and sent it to Andy months ago. Since the topic was "desires" I thought along the lines of "secret desires", which made me think of invisible ink. What better way to encode a secret message in transit. In addition to the card, I needed to find a UV light and send it to Andy as well. So if anyone else wants to send Andy or me a card using invisible ink we are all set to read it!

The card itself was a little difficult to create, since it required using the UV light when drawing so that I could see the details of what I was drawing. I tried various postcards, white, off-white, black and brown. I found that the brown card produced the best results. In the end the card appeared blank, no evidence at all of anything written on it, but with the UV light it showed perfectly.


Next up: schedules.


Week 12 - People


Jeff decided to create a visualization this week about the people on his mind, specifically the tragedies that occurred during the week.


Jeff's postcard:


Notes from Jeff:


This was a tough week of tragedy. Most notably, a Cincinnati police officer, Sonny Kim, was killed in the line of duty on 6/19/2015 and nine people were gunned down in a church shooting in Charleston, South Carolina. Sonny Kim's funeral was broadcast on TV and the Charleston shooting was getting lots of news coverage. There were also other tragedies that were showing up in the news feeds when I was reading about these two tragedies. When the topic of people came up for this week's postcard, I wanted to express my thoughts about all of these people and the innocent lives that were lost.

For the postcard, I outlined a map of the United States and I used a candle to burn spots into the postcard where these cities are located. I was careful when burning the paper, not to let it catch fire or burn a hole in the postcard, so it was a delicate balance of just the right amount of heat. The result of the map was exactly what I was looking for, but in addition, the address side of the postcard seemed to have random marks on them, as if they were bullet holes.

I know the topic this week was heavy and sad, but in the end I felt it visualized the week's events very well. Sonny Kim's Final Call was at 4pm on 6/26/2015. You can watch the video of his Final Call here.


Andy created a viz of his family, incorporating the data into the body of each family member.


Notes from Andy:


Week 12: People was clearly the simplest data collection I've done so far, yet the Tableau visualization and postcard took me the most time. The idea I started with was pretty simple:
   1. Collection basic data about the characteristics of my family
   2. Use shapes in Tableau to create an infographic
   3. Translate the graphic to the postcard

Seems simple, right? I thought so too. The biggest problem was getting the shapes to align by their feet in Tableau. When you use shapes in Tableau, they are drawn outward from the center of the point. So what was happening was that we would all be aligned by the center of our bodies, not our feet.

Fortunately, I work with a lot of really sharp people. First, Damiana Spadafora, one of the students at the Data School, saw what I was working on and had apparently worked on a similar problem for her project last week. She pointed me to this post from Bora Beran, which is frankly quite amazing. I still couldn't get it quite right though, until Chris Love noticed Bora's trick. I'm not going to spoil the secret for you now. I'll detail it in a Tableau Tip Tuesday next week; it's pretty nifty!

Meanwhile, enjoy the story below...


Week 11 - Emotions


Andy examined his emotions during some major events in his life.


Notes from Andy:


Emotion: a strong feeling deriving from one's circumstances, mood, or relationships with others.


Week 11 could not have come at a more perfect time for me. I had so much going on in my life:

   • Putting my family on a plane to Atlanta (before they headed to London a few weeks later)
   • Saying my final goodbyes at Facebook
   • Packing the rest of our stuff for storage
   • Selling our car
   • Saying goodbye to my sister
   • Heading back to London
   • Finishing prep for The Data School.

Throw in marathon training and needless to say, my emotions were all over the board. Basically, I was operating on fumes all week.

My data collection was pretty simple. Since I was already using IFTTT to log Swarm check-ins to Google Sheets, I simply added a column for my emotional state at the time of the check-in. I intentionally did not look back through the data until I was done because I didn't want to bias myself.

The summary is simple: I basically had the emotional state of an 6-month old. I found this to be a really fun analysis, one that I've never done before, and it gave me a very different insight into my week than I expected. Data for the win!

Click on the viz below to view the story.


Jeff was inspired by Chernoff Faces and plotted his entire family's emotions for the week for each morning, afternoon and evening.


Jeff's postcard:


Hopefully this week we brought a smile to your face. :)


Week 10 - To-Do Lists


This week Jeff examined his wife's to-do lists. She keeps 4 different lists, so he combined the lists into categories and visualized by category and task.


Jeff's postcard:


Andy was in the middle of a big move so he visualized the various parts of his life during this time.


Andy's work-in-progress:


Andy's post card:


Mailing the final result:


The timing of the topic for week 10, To-Do Lists, couldn’t have been more perfect. June 8-14 was the last week in our house in California before our big move across the pond. Needless to say, there was lots to do and lots of lists floating around the house, my wife’s head, and my head.

I decided to take a look at the specific activities I was performing. I ended up grouping them in more general categories to improve the visualization; I prefer a bit more simplicity in my life as well as my vizzes. I used several methods for data collection this week: Swarm, Moves, Fitbit, Runkeeper, IFTTT, Sunrise Calendar. From there, I looked at a few specific categories:

   1. Overall rate of tracking - I was curious to see how much of my time I was actually able to account for.
   2. Relocation - I knew I was blowing off packing and the like, mostly because I hate it. The data proved this out.
   3. Sleep - Was the way I was feeling overall possibly due to a lack of sleep? I probably should have looked at sleep quality as well, but I didn’t include that data.
   4. Family time - Was I spending enough time with my family? This is always a huge priority for me.
   5. Running - I was smack in the middle of marathon training. Was I completing my training? Was that impacting anything else?
   6. Work - Tom knew I wouldn’t be working much this week, but would I get ANY work done?
Given this set of goals, I explored the data in Tableau and created a few key stories. The last two tab in the story are images of the postcard. Click on the viz below to explore the story. Enjoy!


See you next week.


Week 9 - Jeff and Andy


This week Andy examined his connections on social media and compared them to mine and the ones we have in common.


Andy's post card:


Andy also did another great Tableau Viz for this week:


Notes from Andy:


Still playing catch up on Dear Data Two. The topic for week 9 was Jeff & Andy. Wow...talk about a topic with unlimited possibilities! Immediately I thought about looking at the connections that we have in common across the major social networks.

I manually created a spreadsheet of our total connections each and our connections in common. I then created random points on a graph in order to display them as a hub & spoke diagram. I referred back to my own blog post for help in shaping the data correctly. This was a bit trickier, though, as I wanted to show Jeff on the left, our common connections in the middle, and my connections on the right. You can download the Excel spreadsheet here.

Some explanations about the viz:

   1. You can click on any combination of things in the bar chart to update the network diagrams.
   2. LinkedIn only shows me when we hit 500 connections, so I totally made up the total connections.
   3. I chose blue for me because it's my favorite color and red for Jeffrey because he lives in Cincinnati and that's the home of the Reds.

Jeff looked at the amount of liquid he drank for the week.


Jeff's post card:


Notes from Jeff:


I was originally going to ask Andy to track his drinking as well and compare our drinking, but he was in the process of moving, starting the Data School and loads of other things going on. This project is hard enough to keep up with tracking your own data, so I didn't want to bog him down further by asking him to track something else too. So I decided to stick with the topic and just track my own consumption of liquid.

I plotted all the liquid I had throughout the week. I drink lots of water, almost all from the tap refilling bottles throughout the day. I don't drink coffee or alcohol, and I rarely drink soda. I do, however, drink lots of iced tea and Arnold Palmer (that's half iced tea and half lemonade for those of you who aren't familiar). The "other" category was mostly Gatorade or Powerade. I averaged just over 4 liters of water per day this week, but I suspect it's higher when I'm not keeping track of how much I am drinking.

Clearly I have a drinking problem, so it's a good thing I'm a "non-alcoholic".


Week 8 - Phone Addiction


This week Jeff tracked the use of his cell phone. He tracked email, texts, Tweets and phone calls. He tracked them both inbound and outbound and if it was computer generated ("not human") vs. human. He also kept track of how many times he checked his phone to get the time or date.


Jeff's post card:


Notes from Jeff:


I was in Minneapolis in early May teaching Data Visualization and Tableau at a workshop for the Annie E. Casey Foundation. During that trip, I lost my Android 4, a very old phone that I kept using because I really liked the keyboard. Since the phone was so old, I gave in. If the phone were the same speed as newer phones today then I might have tried to find a replacement, but this phone was very slow. So with a long overdue upgrade, I upgraded to the Samsung Galaxy 6 Edge. After having it since early May, I have to say, it's the best phone I've ever had. Not only is it really, really fast, it is also very stylish and has a great battery life. So I'm loving this thing. I highly recommend it. Ironic though, having a brand new phone after so many years and then 2 weeks later tracking my "phone addiction". It could not have been more timely.

When creating my post card for this week, I wanted to create an image of a phone, showing the various things I tracked on the phone and drawing them into the design. I tracked the biggest things, email, texts, phone calls and Twitter, and I categorized them into inbound and outbound as well as human and non-human, i.e. automatic emails or alerts. Most of the non-human emails were inbound to Gmail, things like an email subscription blast or the Tableau Viz of the Day. I know I didn't do justice to the beautiful styling of the Samsung Galaxy 6 Edge, but I tried to incorporate some of that styling into the post card.

Andy examined photos that he "liked" on Instagram.


Andy also did another great Tableau Viz for this week:


Notes from Andy:


First, my apologies to Jeffrey for being so tardy getting him postcards. Getting my family moved to London and starting the Data School have gotten in the way. Kudos to him for keeping on top of this project, which has been taking way more of my time than I would have ever anticipated.

Week 8 was supposed to cover the period from May 25-31, but my data collection had a major fail. What I’ve done instead was use IFTTT to capture all pictures that I like on Instagram and log them to a Google Sheet. Note that IFTTT records the date that the picture was taken, not the date that I liked the photo, so the dataset reflects photo dates. Good enough for me!

I then exported the data from Google Sheets into Excel and did some date manipulation before importing the data into Tableau. Once I had the data in Tableau, I began to explore the data to see if any patterns emerged, focusing primarily on whether I liked running or non-running pictures the most. The story points below reflect my thought process. Enjoy!

Notes from Jeff:


I really love how Andy used color and direction on this week's post card. The final result is really beautiful. So far in this project, this is my favorite card from Andy. Although, I think he used donut charts in his Tableau viz on purpose, just to poke at me again for Week 3.


Week 7 - Complaints


This week Andy tracked his frustration level throughout the day and plotted by time.


Here's his draft:


And his final postcard:


Notes from Andy:


During week 7 of Dear Data Two, I recorded my overall frustration level for each hour of each day of the week. I was at the Alteryx Inspire conference most of the week, so I had to keep data collection simple. I used a scale of 0-10, with zero being no frustration and ten being extremely frustrated.

For week 3 Jeffrey sent me a donut chart by accident (so he says…) and while I was thinking about my ideas for this week, I started connecting some data points with lines and ended up with a radar chart. (See the draft version in the story points.) It’s funny how he and I both have gone against what we would consider best practices. What does that mean??

I decided to go with a clock them this week and split the data up between morning and afternoon. From there, I plotted each day going outward from the centre for that hour. For example, at 12am, Monday is closest to the middle and Sunday is farthest from the middle. This helped me see which hours were cumulatively the most frustrating for me for the week. Each dot is separated by the frustration level. If the frustration level was three, then the dot would be 6mm from the previous dot. I then sized the dots by the frustration level so as to double encode the values.

It’s no surprise that my sleeping hours were generally the least frustrating, except for 5am when jet lag kicked in. Overall, 9am was my worst hour in the morning and 1pm was the worst in the afternoon. The story points viz below goes into more of the explanations. Click on the image to read through the story.


Jeff created a "complaint box" and used three colored pills to plot his frustration throughout the week.


Notes from Jeff:


This week I recorded the level of frustration using three colored pills for low, medium and high, and plotting them in 4 major areas of frustration. My frustration level was primarily high as a result of two things. First, when dealing with my Time Warner cable problems. My wife and I don't watch a ton of TV, but there are a few shows we watch on-demand. Unfortunately, when I pause a show for longer than 30 seconds there is a good chance that the show will restart from the beginning or at some random place. This wouldn't such a big frustration if the fast-forward weren't disabled. If we are 30 minutes into a program and it forces us back at the beginning, we often give up. Time Warner is aware of the problem, but have yet to offer a solution. In the meantime we just try to record what we can.

The second area of high frustration is seeing crazy drivers veering out of their lane while texting and driving. I typically notice these drivers way ahead, swerving out of their lane over and over. Inevitably, I pull up along side and in every case it's someone who is looking down at their phone, either texting, emailing or doing something else on their phone. This is frustrating, because you would think after they swerved a single time they would recognize there is a major safety concern, but they just continue on.

We are catching up after some delays. Andy moved and we didn't want to lose post cards in the transition and he was also very busy launching the Data School at the Information Lab. We hope to get back on track quickly and post the backlog of postcards that we have. Thanks for keeping up with our project.


Week 6 - Physical Contact


Jeff tracked his "physical contact" for the week and created a postcard that is "touched" by creating it using braille.


Notice the dimples in the card on each side.


Here are a few pictures to show the texture of the postcard, using flashlights to create some shadow.


Notes from Jeff:


This week turned into a bit of a science experiment. I knew early on that I wanted to create a postcard that could be touched. I tried a number of different methods. First up was wax. I used a candle and a toothpick and was able to get some nice raised dots on the page. This worked very well, but I was concerned that the dots wouldn't last going through the mail. The slightest scrape and the wax would fall right off. I tried a few things to seal the wax on the postcard. Clear nail polish was really messy and didn't work very well, creating a very wet postcard. Scotch tape worked, but took away from the effect of the nice textured wax dots.

I tried needle and thread through the postcard. This was very difficult to do with any precision and to control the holes that were being made in the card and to knot the thread enough. I also tried sewing some buttons on, but even using small buttons created too much weight for the card and it was not very stable. I also tried embossing, at the suggestion of a friend. This worked pretty well, but ultimately a small braille kit was really what I was looking for and gave me the right combination of stability in the card and the precision I needed for the visual.

I used the braille kit to create braille on both sides of the postcard. It took a few attempts, as I quickly realized that I needed to write braille backwards since I was creating the holes on one side of the card that would be read when I flipped it over. Very similar to the week of "Mirrors", when I was doing my entire postcard backwards. Once I had the braille on the postcard, I added the labels, data and the color.

I utilized a tool of visual perception to take some pictures. The typical pictures are nice and show the color, but it's hard to see in those pictures that there is a texture to the card, with raised bumps for the braille. I set up flashlights, from above and from the side of the postcard. This created a shadow effect in the second set of pictures which shows the physical texture of the card.

I had a blast making this week's card and I was really happy with the way it turned out. I may make a copy of this card for myself. I was sad to part with it in the mail!


Andy tracked when his feet touched the ground, walking and running. He used Alteryx and Tableau to put this all together and then created his postcard.


Notes from Andy:


What an amazing week for me for Dear Data Two! The topic for week 6 physical contact and I've been learning Alteryx. The first thing I thought of was physical activity, not physical contact, so I emailed Jeffrey and asked him if he was ok with me taking such liberty on the topic. Fortunately Jeffrey was ok with my idea, but then I decided I could stick to the original contact by extending my thinking a bit.

I'm a huge quantified self data collector, which you'll likely see throughout my Dear Data Two work. I wanted to see how I could use Alteryx to help me get the data into Tableau for analysis before creating my analogue version because I feel like the best way to learn a new tool is to find a practical application. This is the first workflow I built on my own in Alteryx. It might not be the most elegant or most efficient, but I sure did learn a lot along the way. You can download this workflow here.


One of the things I have started to like the most about Alteryx is that I can push all of the complicated row level calculations that I used to do in Tableau to Alteryx, which in the end makes Tableau much faster. For example, I used to multi-row tool to calculate the distance between two geographic points recorded by my watch.

From there, I created the dashboard below to explore the data. In particular I wanted to view the maps and see the summary stats. One thing I learned is that I need to figure out a way to account for times that I paused my watch; that data doesn't appear in the GPX files.

Click here to interact with the dashboard.


Exploring the data Tableau helped me quantify my runs for the week, but that didn't account for all of my physical activity for the week. To capture ALL of my activity:

1.) I noted my total daily steps from Fitbit.
2.) I calculated the number of steps for my runs by taking my stride rate of 184 strides per minute from TomTom and multiplying by the minutes I ran in Strava.
3.) I subtracted my running steps from the total steps to get my walking steps.
4.) I used the time of day that I ran and roughly calculated the proportion of walking steps before and after each run each day.

That resulted in this draft, which is sort of like a dot matrix:


For the final version, I colored the dots: Blue dots represents 200 steps walking and red dots indicate 200 steps running. I rounded the numbers for drawing purposes.


I really learned a ton this week thanks to Dear Data Two because I found a great use case for Alteryx. Not only did I learned a bunch of Alteryx tools I hadn't learned in the training I took at Inspire15, but I also learned how to do row-level calculations in Alteryx and how those can help Tableau performance.

Time to start complaining about next week!


Week 5 - Things We Buy


This week Andy tracked his spending using a number of tools and plotting his spending by day and purchase category. He plotted the data in Tableau using Storypoints. You can check out his Tableau version here.


He then created his analog version:


Notes from Andy:


Week 5 of Dear Data Two was pretty straight forward, but took a bit of data blending to make it work. I had two goals for this week:

   1.) Track every purchase that I make
   2.) Categorize each purchase by the type of goods
   3.) Locations each place where I made a purchase

Precise times were taken from purchase receipts, along with the categorizations. I then recorded the locations of each place by Swarm check-in, which were uploaded to a Google Sheet via IFTTT. I downloaded both sets of data into excel and manually joined them (there were only 19 records so it wasn’t much effort to do manually).

I then explored the data in Tableau, to see what stories I could find, if any. This week took me longer than I was expecting, mostly because I was having trouble finding anything interesting in the data. The one point that stuck out the most is that I spent more on ice cream than Mother’s Day. Oops! Please don’t tell my mom.


Jeff tracked his spending using transactions from his American Express charges and Amazon purchases as well as prorating his monthly expenses to the weekday and categorized them into Maslow's Hierarchy of Needs.


Notes from Jeff:


I'm really not sure how this idea came about. I was thinking about my purchases and how I might categorize them. I decided that I would use Maslow's Hierarchy of Needs to categorize them. Somehow I connected this to the back of a $1 dollar bill which has a pyramid. So I started sketching ideas with that combination.

My first challenge was trying to categorize my purchases into Maslow's Hierarchy. It appears that there are different interpretations of this, for example, in some pyramids my house might be listed as "Shelter" in Physiological needs and in others it might be listed as "Property" in the "Safety and Security" needs. Others might even argue that a very basic house might be in those categories, but a larger house with more features should be in the self-esteem category. So I had to make some calls on where things were going to get categorized. Finding purchases in the self-actualization category was difficult as well. I decided that would be purchases for "learning and artistic purposes". Also, there were purchase that were clearly not needs. Sure, a smoothie is a food, and a healthy one at that, but with meals covered as the very basic need, there really wasn't a place to categorize snacks. So snacks and things like Netflix became their own category of "wants". I didn't prorate every monthly expense, but I did the largest and most basic ones.

Color was a challenge again this week. The green for the money was easy, but I tried several different color combinations for the pyramid colors. I feel so limited with the color pens that I have. I may have to search for additional colors and add one more self-actualization expense in future weeks.

See you next week for physical contact!


Week 4 - Mirrors


Jeff plotted his moods using the Seven Dwarfs in his version of "Mirror, mirror, on the wall" which requires viewing the postcard in the mirror to properly visualize:


A view of the postcard as drawn:


Viewing the postcard in the mirror:


Notes from Jeff:


"Mirror, Mirror, on the Wall": In week 4 of the original Dear-Data.com project, Giorgia used this same title on her postcard. This got me to thinking about how I could incorporate the Seven Dwarfs into my visualization. After all, I have twin daughters, so anything Disney or Princess related is pretty much a hit in my house. I decided to show a "reflection of my moods" using the Seven Dwarfs and the Magic Mirror. I adapted each Dwarf to a mood that I was feeling and then plotted that for the week.

Conclusion: Based on the data, it appears that if I were one of the Seven Dwarfs, I would be "Sleepy".

In creating the visualization for the "Magic Mirror", I drew everything backwards so that the visualization would appear correctly when viewed through a mirror. This was much harder than I thought it would be. Writing backwards was difficult, but the bigger issue was understanding spacing. When writing backwards, I was actually going left to right, as if writing correctly. It might have been easier to go right to left, so that the spacing of the letters when reflected would be normal. For example, after completing the postcard and looking through the mirror, I immediately noticed that the names of the dwarfs were not left justified. In the word "Doc" and writing it backwards as "coD", I should have written the D first instead of the c and then I would have been able to control the spacing better.

Color has been an issue these past few weeks. When creating visualization, color is used in one of three ways, sequential, diverging or categorical. Also, it's important to avoid red and green together in the same shade (i.e. the color value). I have two color ink gel pen sets. Even with those options, my color choices are very limited. During this week, I wanted to utilize a sequential color scheme, but I don't have pens that are light to dark in a single color for 4 distinct values. I picked colors that would emulate a sequential scheme, but even so, it shows more like a categorical color scheme. I'm sure this will be a problem in future weeks as well.

For a Tableau version of this week, I made 4 custom shapes snipping images from my postcard, one for each of the pen scribble colors. Then I added a custom color palette for those same colors to my preference file. I created two sheets and mashed them together on a dashboard.


And here is the "Mirrored" version done in Tableau using "Street Slab Mirror" font, a few calculated fields to type the labels backward, reversing the order of the table and adding a "-" sign in front of the Sum so it would plot negative.


Andy recorded every time he saw himself in a mirror, window or anything else, noting the location, place and time. He then plotted the data in Tableau using Storypoints. You can check out his Tableau version here.


He then created his analog version:


Notes from Andy:


For this week's theme “Mirrors”, I explored the data in Tableau and created a story about my week of mirrors and reflections. This was quite a tough week from a data collection perspective. I explored a series of questions and found some interesting insight. For example, as the week progressed, I became more conscious of NOT "seeing" myself. I’m not totally satisfied with my analog version, but done is better than perfect.

Until next week where we look at the things we buy!


Week 3 - Thank Yous


Andy tracked his emails for the week comparing thank yous by gender:


An initial draft:


The final result:


Notes from Andy:


I found this week particularly challenging from a data collection stand point. I started with a couple of ideas, like tracking who I said thank you too, but that was way too hard to keep up with. In the end, I decided to look at how people said thank you throughout the week in my email. I went in with the assumption that people, particularly me, were really good at saying thank you in emails. Boy was I wrong!

I went through every single email for the week and created a spreadsheet in Excel of who sent it (me or someone else), what was their gender (male, female or computer), and did the email include some form of thank you. I then explored the data in Tableau to see if there were any particular themes that I could then transform into the analogue version. Instead, I ended up creating a story in Tableau, which you can find here.

I ended up borrowing a bit from what Giorgia did in her week 3 here, but really only from a conceptual perspective. What I wanted to get to was how thankful or unthankful was each day. So I created a dot for each email. If the dot is above the previous dot, then the email included a form of thank you. If the dot is lower than the previous dot, then there was no thank you. Viewing the data this way helped me easily see how unthankful my emails were for the week; the patterns make it obvious.


Jeff looked back in time to compare how many thank you notes he and his wife wrote when his twin daughters were born compared to how many they wrote when his father passed away:


Notes from Jeff:


"Correspondence in Life and Death": This week I took the liberty of using some old data. I wanted to compare the number of thank you notes from 2 major events in my life, the birth of my twin girls in 2006, and the death of my father back in 2013. I knew that we had a list of thank yous that we used to keep track. I compiled this list and began the visualization. My intent was to "grow a tree" using the little shapes. I had a lace doily that came with a pack of postcards that I bought for this project, so I used it to fill in the little marks. When I began at the bottom to "grow the tree", I quickly realized that I had way too many marks to create what I wanted. As I continued it became clear that I was going to fill in nearly every hole of the doily. So I decided to stay with the pattern, keeping death and life together with the two different colors. When I was finished I used those colors and a distinct font to distinguish them from each other. I completed the card and put it on the fireplace mantle in my office at home.

The following night, I returned to the office to start working on the next post card. I looked up to admire my work and stared at the card for nearly a minute. Then it hit me. I said out loud, "Really? You've GOT to be kidding me." I had just realized that I had created a donut chart with my pattern. Talk about "not seeing the forest through the trees". I was so focused on making the little marks, going from my "tree" concept to the "doily circle" that I didn't even realize that I had created a donut chart that basically had a KPI indicator in the middle. This was hilarious to me and ironic, because Andy and I had just recently been discussing KPI donut charts. There are a number of threads and tweets exchanged on this topic, but you can read my thoughts about this here. I was very happy with this week's results, regardless of my feelings toward KPI donut charts and best practice. I figured I would be hearing from Andy on this, especially in light of our recent dialog. I was thinking he might send a note, "only took you 3 weeks to break best practices" and then reference my own link back to me.

I think there's a few lessons in this. First, being caught up in the details so much that I didn't see the big picture. Also, not being afraid to step away from best practices at times to explore other techniques. In this case, my goal was not for the reader to make a precise quantitative comparison with the donut slices, because that isn't needed here. Not only wasn't it my goal, it was an accidental design.

I am very excited about week 4. It's already complete and in the mail.


Week 2 - Transportation


Jeffrey tracked his step pattern around his office:


Notes from Jeff:


The concept for week 2 was a bit easier for me. I had an idea of what I wanted to do and I was able to create it very quickly. My inspiration came from watching Harry Potter and the Prisoner of Azkaban with my girls. Marauder's Map is a central element in the movie and it maps the movements of various characters around Hogwarts. In the original dear-data project the topic was more specific, tracking public transportation. My choices were somewhat limited, since I drive to work. Instead, I thought about my footsteps in the office. I drew the office floor plan (without any assistance from a real floor plan) and then began plotting my traffic pattern.

One thing that I find very interesting in this process is the attention to detail. There are things that we take for granted when we work with tools to create our visualization, for example, fonts. When creating data visualizations in Tableau (or most any other tool) there are loads of fonts available and many more custom fonts that can be downloaded. In the first post card, I wanted an LED style font. For this postcard, I was looking for something that had breaks in it, similar to what the footsteps looked like. With something like Tableau, I could easily page through and try dozens of fonts and update it with a click of a button. Since we're hand drawing on post cards, these finer elements of design take considerably more time and effort. I've studied typography a good bit, but I've never taken a class on "how to draw" these different fonts. Now that I'm spending more time hand drawing, I find myself paying more attention to these finer details. I look forward to exploring more of this as we progess each week.

This week's viz was a little more work than last week's viz in Tableau. It required using a background image with X/Y positions for the footprints. I used Photoshop to rotate a pair of footprints in 12 positions, like a clock. Then I mapped out the footprints over the office map using custom shapes.


Andy collected data of his daily travel. What was different for him this week is that he first built a viz in Tableau to map his routes and then he sketched it on paper.


Notes from Andy:


Collecting the data for Week 2: Transport was pretty simple for me as I collect this data every day anyway. Whenever I go somewhere, I use Foursquare to check-in. This then gets logged to Google Sheets via IFTTT. I exported the Google Sheet to Excel, added a few columns to get the Lat/Long, paths, and distances between points.

For walking and running, I collected the data via RunKeeper. Walks are recorded automatically based on the motion sensor in my iPhone. Runs are captured via my TomTom watch and uploaded to RunKeeper via their API.

I knew I wanted to draw a path diagram, but I don’t have good distance perception in London yet, so I imported the data into Tableau in order to see the paths between points by day of the week.

I wanted my final drawing to sort of be the opposite of how I did the coloring in Tableau. I wanted to color the lines by activity type rather than the dots. This is the first time that I’ve gone from Tableau to hand drawn; usually it’s the other way around, but Tableau was super helpful in showing me the patterns of my days.

On to Week 3!


Week 1 - Time


The early pictures of the postcards for week 1 are now posted.

Andy's early draft:


Using a ruler as a straight edge and a key to draw small circles:


Andy's final postcard:


Notes from Andy:


The Dear Data Two project is much harder than I thought it would be. I’m not very good at drawing, so I figured this would be a good way for me to pull away from tools and think more conceptually. I’m certain that my way of thinking about visualization will change and grow through the weeks.

I’m an avid Fitbit fan so I had an early idea on what I wanted to do for week 1; I wanted to track my sleep patterns. Fortunately Fitbit has a decent reporting interface that showed me my sleep patterns, so I used that as my starting idea. I then broke the data down logically by hour (x-axis) and day (y-axis).

I bought a small drawing kit including rulers, pens and white card stock which I’m cutting in half to make postcards. I wanted to make nice circles, so I used the end of a key for the outline, which worked really well. I didn’t know if the “rules” allowed for using tools like a ruler, but I did anyway. I’m a very organized, orderly person, so have jittery, hand-drawn lines would have driven me crazy.


Jeff's final postcard:


Notes from Jeff:


Week 1 was hard. I ordered blank postcards and color gel ink pens ahead of time so that I would be ready for this. Then when it came time to design I tried so many different things.

To help represent "time", I used an LED style font and mixed in a few analog clocks. When I started plotting time, always on the x-axis, I experimented with many forms. I tried different forms of musical notation, which is showcased throughout Giorgia Lupi's work. I sketched various note styles, rests, percussion symbols, etc. One of my many sketches looked a bit like Gregorian chant notation.


After seeing this, I ended up with something akin to a Gantt chart. My time routine for the week was interesting to see. I quickly noticed that, on average, I didn't go to sleep until 1 a.m. for this particular week.

Just for fun, after I mailed the post card I decided to recreate it using Tableau.

On to Week 2!